Your Question: Digital First Industries (DFI) is a provider of software solutions that help individuals and small businesses manage their finances. DFI recently developed and released a set of mobile applications that cater to specific customer needs (BudgetPlus, InvestorPro, SimpleSavings, PayPlan, Transact). To help identify which of these apps is most popular with customers and is worth devoting more resources to, you have been tasked with analyzing data that has been captured and creating a dashboard to track activity. Tasks: Using the data in the Monthly_App_Downloads worksheet: Create a new worksheet called App_Downloads_Reportwith the following four charts (all your charts should be formatted, labelled, and titled appropriately): A clustered column chartshowing the number of downloads for each mobile application over the course of the months from January to June. For this chart, your horizontal axis should consist of month names, and your vertical columns should be based on the downloads for each app during those months. A 2-D regular pie chartshowing the percent breakdown of downloads among the five apps for the month of May. Based on the chart, determine which app was the least popular and provide your answer in the workbook. A clustered column chartshowing the performance of the InvestorPro and SimpleSavings apps over the course of the months from January to June. The chart should contain a data table at the bottom and a linear trend line for each app to highlight the overall traffic trend. Color an increasing trendline as green, a decreasing one as red, or a stable one as black (Note: you will have to format the trend lines manually). A scatter chartfor the InvestorPro app over the course of the months from January to June. Configure the appropriate chart elements to clear display the linear trend line equation estimating the data points for the InvestorPro app. Based on the information in the chart, what would be the estimate for downloads for July? Provide your answer in the workbook.
Your Question: Digital First Industries (DFI) is a provider of software solutions that help individuals and small businesses manage their finances. DFI recently developed and released a set of mobile applications that cater to specific customer needs (BudgetPlus, InvestorPro, SimpleSavings, PayPlan, Transact). To help identify which of these apps is most popular with customers and is worth devoting more resources to, you have been tasked with analyzing data that has been captured and creating a dashboard to track activity. Tasks: Using the data in the Monthly_App_Downloads worksheet: Create a new worksheet called App_Downloads_Reportwith the following four charts (all your charts should be formatted, labelled, and titled appropriately): A clustered column chartshowing the number of downloads for each mobile application over the course of the months from January to June. For this chart, your horizontal axis should consist of month names, and your vertical columns should be based on the downloads for each app during those months. A 2-D regular pie chartshowing the percent breakdown of downloads among the five apps for the month of May. Based on the chart, determine which app was the least popular and provide your answer in the workbook. A clustered column chartshowing the performance of the InvestorPro and SimpleSavings apps over the course of the months from January to June. The chart should contain a data table at the bottom and a linear trend line for each app to highlight the overall traffic trend. Color an increasing trendline as green, a decreasing one as red, or a stable one as black (Note: you will have to format the trend lines manually). A scatter chartfor the InvestorPro app over the course of the months from January to June. Configure the appropriate chart elements to clear display the linear trend line equation estimating the data points for the InvestorPro app. Based on the information in the chart, what would be the estimate for downloads for July? Provide your answer in the workbook.

MATLAB: An Introduction with Applications
6th Edition
ISBN:9781119256830
Author:Amos Gilat
Publisher:Amos Gilat
Chapter1: Starting With Matlab
Section: Chapter Questions
Problem 1P

Related questions
Question
Your Question:
Digital First Industries (DFI) is a provider of software solutions that help individuals and small businesses manage their finances. DFI recently developed and released a set of mobile applications that cater to specific customer needs (BudgetPlus, InvestorPro, SimpleSavings, PayPlan, Transact).
To help identify which of these apps is most popular with customers and is worth devoting more resources to, you have been tasked with analyzing data that has been captured and creating a dashboard to track activity.
Tasks:
Using the data in the Monthly_App_Downloads worksheet:
- Create a new worksheet called App_Downloads_Reportwith the following four charts (all your charts should be formatted, labelled, and titled appropriately):
- A clustered column chartshowing the number of downloads for each mobile application over the course of the months from January to June. For this chart, your horizontal axis should consist of month names, and your vertical columns should be based on the downloads for each app during those months.
- A 2-D regular pie chartshowing the percent breakdown of downloads among the five apps for the month of May. Based on the chart, determine which app was the least popular and provide your answer in the workbook.
- A clustered column chartshowing the performance of the InvestorPro and SimpleSavings apps over the course of the months from January to June. The chart should contain a data table at the bottom and a linear trend line for each app to highlight the overall traffic trend. Color an increasing trendline as green, a decreasing one as red, or a stable one as black (Note: you will have to format the trend lines manually).
- A scatter chartfor the InvestorPro app over the course of the months from January to June. Configure the appropriate chart elements to clear display the linear trend line equation estimating the data points for the InvestorPro app. Based on the information in the chart, what would be the estimate for downloads for July? Provide your answer in the workbook.
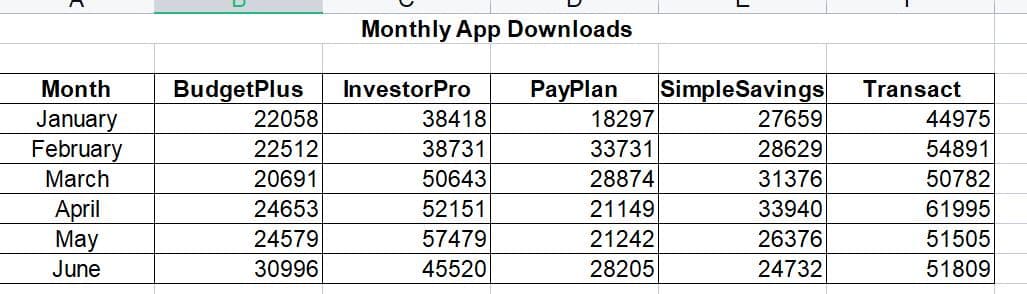
Transcribed Image Text:Month
January
February
March
April
May
June
BudgetPlus
22058
22512
20691
24653
24579
30996
Monthly App Downloads
PayPlan
InvestorPro
38418
38731
50643
52151
57479
45520
18297
33731
28874
21149
21242
28205
SimpleSavings
27659
28629
31376
33940
26376
24732
Transact
44975
54891
50782
61995
51505
51809
Expert Solution
This question has been solved!
Explore an expertly crafted, step-by-step solution for a thorough understanding of key concepts.

Step by step
Solved in 5 steps with 4 images

Recommended textbooks for you
MATLAB: An Introduction with Applications
Statistics
ISBN:
9781119256830
Author:
Amos Gilat
Publisher:
John Wiley & Sons Inc

Probability and Statistics for Engineering and th…
Statistics
ISBN:
9781305251809
Author:
Jay L. Devore
Publisher:
Cengage Learning

Statistics for The Behavioral Sciences (MindTap C…
Statistics
ISBN:
9781305504912
Author:
Frederick J Gravetter, Larry B. Wallnau
Publisher:
Cengage Learning
MATLAB: An Introduction with Applications
Statistics
ISBN:
9781119256830
Author:
Amos Gilat
Publisher:
John Wiley & Sons Inc
Probability and Statistics for Engineering and th…
Statistics
ISBN:
9781305251809
Author:
Jay L. Devore
Publisher:
Cengage Learning
Statistics for The Behavioral Sciences (MindTap C…
Statistics
ISBN:
9781305504912
Author:
Frederick J Gravetter, Larry B. Wallnau
Publisher:
Cengage Learning

Elementary Statistics: Picturing the World (7th E…
Statistics
ISBN:
9780134683416
Author:
Ron Larson, Betsy Farber
Publisher:
PEARSON

The Basic Practice of Statistics
Statistics
ISBN:
9781319042578
Author:
David S. Moore, William I. Notz, Michael A. Fligner
Publisher:
W. H. Freeman

Introduction to the Practice of Statistics
Statistics
ISBN:
9781319013387
Author:
David S. Moore, George P. McCabe, Bruce A. Craig
Publisher:
W. H. Freeman