Your Task… Using your assigned financial statements calculate the required ratios below Indicate if the change from year to year is favorable or unfavorable. All values should be accurate to at least two decimal places. The expectation is to submit a professional report free of grammar and spelling errors and easy to read. Think of this as a menu you would be handing to a customer. All calculations are to be represented. Analysis of Profitability Gross Profit Ratio Operating Profit Ratio Net Profit Ratio Sales to Total Assets Ratio Return on Total Assets Return on Equity Earnings Per Share
Your Task… Using your assigned financial statements calculate the required ratios below Indicate if the change from year to year is favorable or unfavorable. All values should be accurate to at least two decimal places. The expectation is to submit a professional report free of grammar and spelling errors and easy to read. Think of this as a menu you would be handing to a customer. All calculations are to be represented. Analysis of Profitability Gross Profit Ratio Operating Profit Ratio Net Profit Ratio Sales to Total Assets Ratio Return on Total Assets Return on Equity Earnings Per Share

Fundamentals of Financial Management (MindTap Course List)
15th Edition
ISBN:9781337395250
Author:Eugene F. Brigham, Joel F. Houston
Publisher:Eugene F. Brigham, Joel F. Houston
Chapter4: Analysis Of Financial Statements
Section: Chapter Questions
Problem 24P: Income Statement for Year Ended December 31, 2018 (Millions of Dollars) Net sales 795.0 Cost of...

Related questions
Question
Your Task…
- Using your assigned financial statements calculate the required ratios below
- Indicate if the change from year to year is favorable or unfavorable.
- All values should be accurate to at least two decimal places.
- The expectation is to submit a professional report free of grammar and spelling errors and easy to read. Think of this as a menu you would be handing to a customer.
- All calculations are to be represented.
Analysis of Profitability
- Gross Profit Ratio
- Operating Profit Ratio
- Net Profit Ratio
- Sales to Total Assets Ratio
- Return on Total Assets
- Return on Equity
- Earnings Per Share
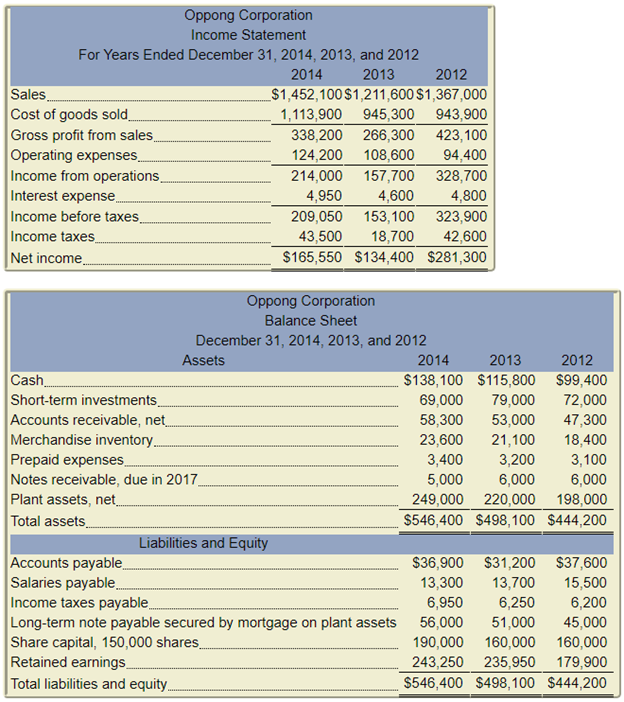
Transcribed Image Text:Oppong Corporation
Income Statement
For Years Ended December 31, 2014, 2013, and 2012
2013
2014
2012
Sales
Cost of goods sold
$1,452,100$1,211,600 $1,367,000
1,113,900 945,300
943,900
Gross profit from sales,
Operating expenses.
Income from operations,
Interest expense
Income before taxes.
338,200 266,300
423,100
94,400
328,700
124,200
108,600
214,000 157,700
4,950
4,600
4,800
209,050 153,100
18,700
323,900
Income taxes
43,500
42,600
Net income
$165,550 $134,400 $281,300
Oppong Corporation
Balance Sheet
December 31, 2014, 2013, and 2012
Assets
2014
2013
2012
Cash
Short-term investments_
Accounts receivable, net
Merchandise inventory
Prepaid expenses,
Notes receivable, due in 2017
Plant assets, net
Total assets
$138,100 $115,800 $99,400
79,000
69,000
58,300
72,000
47,300
53,000
23,600
21,100
18,400
3,200
6,000
3,100
6,000
3,400
5,000
249,000 220,000 198,000
$546,400 $498,100 $444,200
Liabilities and Equity
Accounts payable
Salaries payable.
Income taxes payable,
$36,900 $31,200 $37,600
13,700
13,300
15,500
6,950
6,250
6,200
45,000
Long-term note payable secured by mortgage on plant assets
51,000
56,000
190,000 160,000 160,000
Share capital, 150,000 shares.
Retained earnings
Total liabilities and equity.
243,250 235,950
$546,400 $498,100 $444,200
179,900
Expert Solution
This question has been solved!
Explore an expertly crafted, step-by-step solution for a thorough understanding of key concepts.

Step by step
Solved in 2 steps with 1 images

Knowledge Booster


Learn more about
Need a deep-dive on the concept behind this application? Look no further. Learn more about this topic, accounting and related others by exploring similar questions and additional content below.Recommended textbooks for you
Fundamentals of Financial Management (MindTap Cou…
Finance
ISBN:
9781337395250
Author:
Eugene F. Brigham, Joel F. Houston
Publisher:
Cengage Learning

Financial Accounting: The Impact on Decision Make…
Accounting
ISBN:
9781305654174
Author:
Gary A. Porter, Curtis L. Norton
Publisher:
Cengage Learning

Cornerstones of Financial Accounting
Accounting
ISBN:
9781337690881
Author:
Jay Rich, Jeff Jones
Publisher:
Cengage Learning
Fundamentals of Financial Management (MindTap Cou…
Finance
ISBN:
9781337395250
Author:
Eugene F. Brigham, Joel F. Houston
Publisher:
Cengage Learning
Financial Accounting: The Impact on Decision Make…
Accounting
ISBN:
9781305654174
Author:
Gary A. Porter, Curtis L. Norton
Publisher:
Cengage Learning
Cornerstones of Financial Accounting
Accounting
ISBN:
9781337690881
Author:
Jay Rich, Jeff Jones
Publisher:
Cengage Learning

Financial & Managerial Accounting
Accounting
ISBN:
9781285866307
Author:
Carl Warren, James M. Reeve, Jonathan Duchac
Publisher:
Cengage Learning

Survey of Accounting (Accounting I)
Accounting
ISBN:
9781305961883
Author:
Carl Warren
Publisher:
Cengage Learning

Intermediate Accounting: Reporting And Analysis
Accounting
ISBN:
9781337788281
Author:
James M. Wahlen, Jefferson P. Jones, Donald Pagach
Publisher:
Cengage Learning