Requirements: a. Prepare horizontal analysis based on the above statements presented (for percent: round of your answers to 2 decimal places) Music Lover, Inc.xlsx b. Evaluate the company's financial position and results of operation using the comparative statement analysis i. Short-term solvency analysis ii. Long-term financial position analysis iii. Operating efficiency and profitability analysis
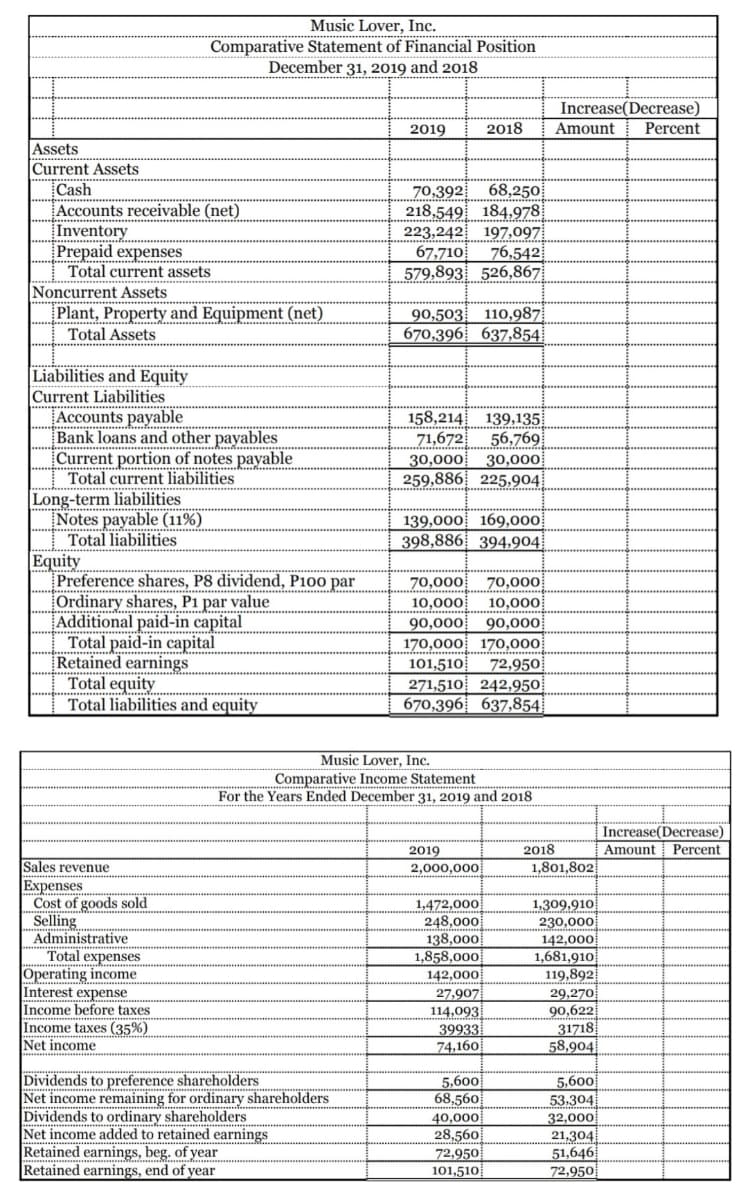
Q: a) Calculate the return on assets. (Enter your answer as a percent rounded to 2 decimal places.) b)…
A: Return on Assets is one of the method for determining the profitability of a company. This ratio…
Q: Help
A: Accounting: Accounting is a system, or a process of collecting and organizing economic transactions,…
Q: (A)Prepare ratio analyses (for 2019, 2018, and 2017) for both companies.You should include the…
A: “Since you have asked multiple sub-parts, we will solve the first three sub-parts for you. If you…
Q: Problem 1: Viance Queen Company Required: Compute for the company’s profitability and operating…
A: "Since you have posted a question with multiple sub-parts, we will solve first three sub-parts for…
Q: ratios for the comparative periods
A: (Note: Since you have posted a multi-part question, we will solve the first three parts for you. For…
Q: Which of the following statements regarding the income statement is true?a. The income statement…
A: The financial statements of the business are prepared for presenting the results of operations…
Q: tequired: n the table below, calculate Net Profit Margin, Asset Turnover, Financial Leverage, and…
A: solution formula used Revenue =COGS + gross profit net profit margin =net…
Q: ratios listed on table a for each year (2020 & 2021): a. For each ratio includes the formula with…
A: The answers have been mentioned below.
Q: TRUE OR FALSE: Read each sentence carefully and determine whether the statement True or False. Write…
A: Financial statement analysis is not for the future of the company but the present performance of the…
Q: 6. Selected data for Katan, Inc. at 12/31/21 is as follows: Total assets Total liabilities Net sales…
A: Note: Question 4 mentions references to Questions 1 & 2, but the details of Question 1 &2…
Q: Determine the sales or cost of good sold of a firm given the following information: Current ratio =…
A: Sale price of goods depends on majority of factors depending on the profit margin , production cost,…
Q: Match the following terms Question 1 options: benchmarking analysis ratio analysis…
A: Lets understand the meaning of benchmarking analysis, ratio analysis, solvency and liquidity.…
Q: a. Prepare a common-sized income statement comparing the results of operations for Smith Electronics…
A: The common size income statement shows the year-on-year trend and indicates the direction of the…
Q: Methodology: • Based on the above information the consulting group will conduct ratio analysis for…
A: Ratio Analysis - The ratio is the technique used by the prospective investor or an individual or…
Q: Required: Compute and interpret the following financial ratios of the company for Year 5: a.…
A: Acid test Ratio Return on Assets (ROA) Return on common stockholders’ equity (ROE) Earnings per…
Q: 1. Earnings per share. (Round your answer to 2 decimal places.) 2. Price-earnings ratio. (Round…
A: Below mentioned Ration needs to be calculated Earning Per share Price Earning Ratio Dividend…
Q: VII. Direction: Compute and interpret. The following comparative financial statements are provided…
A: Accounting ratios are an important source for the interpretation of the financial information…
Q: (A)Prepare ratio analyses (for 2019, 2018, and 2017) for both companies.You should include the…
A: Ratio analysis: This is the quantitative analysis of financial statements of a business enterprise.…
Q: Assessment Task 1- COMPREHENSIVE PROBLEMS Below are the comparative Statement of Comprehensive…
A: Profitability ratios are those ratios which are used and calculated for the purpose of analysing…
Q: Compute the following financial ratios using the given financial statements below. Round off your…
A: Net profit ratio is the ratio which states and measures as well as shows how much company has net…
Q: A.Profitability ratio a. Return on Assets: ROA (NI/Total Assets) ROA (NI/Average Assets) ROA…
A: Hi student Since there are multiple subparts, we will answer only first three subparts.
Q: a. Prepare a vertical analysis of Midnight Enterprises' income statements. If required, round…
A: Solution:- a)Preparation of Vertical analysis as follows under:- Note:- Income statement vertical…
Q: Required: Compute for the company’s profitability and operating efficiency ratios for 2019 Compute…
A: The ratio analysis helps to analyze the financial statements of the business.
Q: Resolve and explain the result of the current ratio for XYZ Company and compare and explain this…
A: The current ratio is a liquidity ratio that assesses a corporation's capacity to pay short-term…
Q: your answers onthe space provided before each number. 1. Profitability ratios measure the ability of…
A: Accounting ratios refers to those ratios which compare the line items of the financial statements…
Q: VII. Direction: Compute and interpret. The following comparative financial statements are provided…
A: The question is related to Ratio Analysis. Efficiency or performance or turnover ratio are…
Q: a) Prepare a projected income statement for the year to 31 October Year 8. b) Calculate for Year 7…
A: Note: Since we only answer up to 3 sub-parts, we’ll answer the first 3. Please resubmit the question…
Q: VII. Direction: Compute and interpret. The following comparative financial statements are provided…
A: By examining financial accounts such as the balance sheet and income statement, ratio analysis is a…
Q: Solve the following ratios from year 2018-2020. Show complete solutions/computations. -CURRENT RATIO…
A: Current ratio is the ratio of Current assets to current liabilities. The current ratio is a…
Q: Required Prepare a vertical analysis of both the balance sheets and income statements for Year 4 and…
A: The Statement of Comprehensive Income - The statement of comprehensive income is the profit earned…
Q: Compute the following for Stanley Limited. Round your answers to two decimal places. All answers…
A: The question is related to the Ratio Analysis. Ratio is the indicated quotient of two mathematical…
Q: NOTE: JUST ANSWER THE HIGHLIGHTED ONEs p.s. please provide an interpretation, THANK YOU!! MUCH…
A: Ratio analysis helps in comparing the line-item data from the financial statements of the…
Q: repare and Interpret a complete ratio analysis for the years 2019 & 2020 operations using the…
A: Ratio Analysis is used to analyse the financial condition of a company. Some examples are liquidity…
Q: Question 1 For each company, calculate the following ratios: · Use the formula sheet provided. · You…
A: 1. Gross profit percentage = Gross profit/ Sales 2.Return on capital employed = Net profit/…
Q: VII. Direction: Compute and interpret. The following comparative financial statements are provided…
A: Ratio analysis helps in comparing the line-item data from the financial statements of the…
Q: Hello! look at the attached images and answer: (a) Calculate ratios for the year ended 31 December…
A: Introduction:- Ratio Analysis is used to interpretation of the company's financial performance over…
Q: You are required to calculate: 1. Liquidity ratios 2. Solvency rations 3. Profitability ratios…
A: 1. Liquidity ratios: Current ratio (CR) is the division of current assets (CA) by current…
Step by step
Solved in 3 steps with 5 images
- Sound Break CorporationIncome and Retained Earnings StatementFor the year Ended December 31, 2020Net Sales P1,000,000Cost of Goods Sold:Inventory, Dec. 31, 2019 P250,000Purchases 720,000Total Goods Available P970,000Inventory 220,000 750,000Gross Margin on Sales P 250,000Selling and Administrative (including Depreciation of P20,000) 125,000Net Income before Tax P 125,000Provision for Income Tax 35,000Net Income for the Year P 90,000Retained Earnings, beginning 130,000Total P 220,000Dividends Paid 30,000Retained Earnings, December 31, 2020 P 190,000 Sound Break CorporationBALANCE SHEETDecember 31, 2019 and 2020 ASSETS 2019 2020Current Assets:Cash P 75,000 P 85,000Marketable Securities 25,000 25,000Trade Receivables, net 185,000 245,000Inventory, at cost 250,000 220,000Prepaid Expenses 15,000 10,000Total Current Assets P550,000 P585,000Property and Other Assets:Equipment, net P340,000 P320,000Other Assets 15,000 15,000Total Property and Other Assets P355,000 P335,000 Total Assets…Here is comparative balance sheet for 2021 and 2022, stating each asset as a percent of total assests and each liability and stockholders' equity item as a percent of the total liabilities and stockholders' equity. 2020 (%) 2021 (%) Assets Cash 43,500 8.84 55,000 14.25 Inventory 22,000 4.47 23,500 6.09 Equipment and fixures 380,000 77.24 255,000 66.08 Supplies 3,800 0.77 4,100 1.06 Prepaid expenses 9,200 1.87 12,500 3.24 Store design/Buildout 27,000 5.49 27,000 7.00 Loan Fee 4,000 0.81 5,500 1.42 Advertising and Marketing 2,500 0.51 3,300 0.86 Total assets 492,000 100.00 385,900 100.00 Bank Loan 150,000 30.49 170,000 44.05 Other liability (Balancing figure) 292,000 59.35 170,900 44.29 Owner contribution 50,000 10.16 45,000 11.66 Total equity and liability 492,000 100.00 385,900 100.00 Please explain or make an assumption of the figureA comparative balance sheet for Carter Fuel Injection Systems, Inc. appears below:Carter Fuel Injection Systems, Inc.Comparative Balance SheetDec. 31, 2020 Dec. 31, 2019AssetsCash $ 34,000 $11,000Accounts receivable 25,000 13,000Inventory 18,000 17,000Prepaid expenses 11,000 9,000Long-term investments -0- 17,000Equipment 55,000 33,000Accumulated depreciation—equipment (20,000) (15,000)Total assets $123,000 $85,000Liabilities and Stockholders' EquityAccounts payable $ 27,000 $ 7,000Bonds payable 35,000 45,000Common stock 31,000 23,000Retained earnings 30,000 10,000Total liabilities and stockholders' equity $123,000 $85,000Additional information:1. Net income for the year ending December 31, 2020 was $35,000.2. Cash dividends of $15,000 were declared and paid during the year.3. Long-term investments that had a cost of $17,000 were sold for $14,000.4. No equipment was sold during 2020.HINT: depreciation expense must be determined. Notice in #4 it states no equipment was “sold”during…
- Summary financial information for Gandaulf Company is as follows.Compute the amount and percentage changes in 2020 using horizontal analysis, assuming 2019 is the base year. (Enter negative amounts and percentages using either a negative sign preceding the number e.g. -45, -45% or parentheses e.g. (45), (45%). Round percentages to 2 decimal places, e.g. 1.25%.) Increase (Decrease) in 2020 December 31, 2020 December 31, 2019 Amount Percent Current Assets $ 180,600 $ 210,000 $ enter a dollar amount enter your answer in percentages rounded to 2 decimal places % Plant Assets 821,600 790,000 enter a dollar amount enter your answer in percentages rounded to 2 decimal places % Total assets $ 1,002,200 $ 1,000,000 $ enter a total of the two previous amounts enter your answer in percentages rounded to 2 decimal placesSandhill Co. reported the following information for 2020: Sales revenue $2520000 Cost of goods sold 1748000 Operating expenses 282000 Unrealized holding gain on available-for-sale securities 85700 Cash dividends received on the securities 9200 For 2020, Sandhill would report comprehensive income of A.$85700. B.$499200. C.$575700. D.$584900.A comparative balance sheet for Gena Company appears below:GENA COMPANYComparative Balance SheetDec. 31, 2021 Dec. 31, 2020AssetsCash $ 34,000 $11,000Accounts receivable 21,000 13,000Inventory 35,000 17,000Prepaid expenses 6,000 9,000Long-term investments -0- 17,000Equipment 60,000 33,000Accumulated depreciation—equipment (20,000) (15,000)Total assets $136,000 $85,000Liabilities and Stockholders' EquityAccounts payable $ 17,000 $ 7,000Bonds payable 36,000 45,000Common stock 53,000 23,000Retained earnings 30,000 10,000Total liabilities and stockholders' equity $136,000 $85,000Additional information:1. Net income for the year ending December 31, 2021 was $35,000.2. Cash dividends of $15,000 were declared and paid during the year.3. Long-term investments that had a cost of $17,000 were sold for $14,000.4. Depreciation expense for the year was $5,000.InstructionsPrepare a full statement of cash flows for the year ended December 31, 2021, using the indirectmethod.
- The Kelly Services, Inc., and subsidiaries partial statement s of earnings from its annual report are presented below. 2020 2019 Revenues from services 4314.8 5517.3 Cost of services 3613.1 4539.7 Gross Profit 701.7 977.6 Selling and administrative expense 794.7 967.4 Asset impairments 53.1 80.5 Net earnings (loss) (164.1) (70.3) Prepare a horizontal common size analysis, and comment on the trend.Fill in thr blanks on the table below and show the formulas used for each value Dayton, Inc. Annual Income Statement (Values in Millions) Common Size 2019 2018 2019 2018 Sales $ 178,909 $ 187,510 100.0% 100.0% Cost of Sales 111,631 59.5% Gross Operating Profit $ 75,879 40.5% Selling, General & Admin. Expense 12,900 6.9% Other Expenses 33,377 17.8% EBITDA $ 29,602 15.8% Depreciation & Amortization 7,944 4.2% EBIT $ 21,658 11.6% Other Income, Net 3,323 1.8% Earnings Before Interest and Taxes $ 24,981 13.3% Interest Expense 293 0.2% Earnings Before Taxes $ 24,688 13.2% Income Taxes 5,184 0.21 tax rate Net Income Available to Common $ 19,504 10.4% Dividends per share $ 1.15 $ 0.91 EPS…HIC GROUP OF Companies COMPARATIVE INCOME STATEMENT For years ended 3rd December 2019 2020 Revenue and gains Sales revenue 495,500 496,738.75 Interest revenue 278,500 279,196.25 Investment Income 71,700 71,879.25 Other revenue 101,500 101,753.75 Total revenue and gains 947,200 949,968 Expenses and losses Cost of good sold 450,000 447,750 Selling&administrative 185,000 184,075 Computer (operating) 42,500 42,288…
- HIC GROUP OF Companies COMPARATIVE INCOME STATEMENT For years ended 3rd December 2019 2020 Revenue and gains Sales revenue 495,500 496,738.75 Interest revenue 278,500 279,196.25 Investment Income 71,700 71,879.25 Other revenue 101,500 101,753.75 Total revenue and gains 947,200 949,968 Expenses and losses Cost of good sold 450,000 447,750 Selling&administrative 185,000 184,075 Computer (operating) 42,500 42,288 Depreciation 50,000…Compute RNOA with Disaggregation Refer to the balance sheet information below for Home Depot. $ millions Feb. 3, 2019 Jan. 28, 2018 Operating assets $9,940 $9,636 Nonoperating assets 419 846 Total assets $10,359 $10,482 Operating liabilities $3,926 $3,777 Nonoperating liabilities 6,874 6,362 Total liabilities $10,800 $10,139 Net sales $25,471 Operating expense before tax 21,815 Net operating profit before tax (NOPBT) 3,656 Other expense 229 Income before tax 3,427 Tax expense 809 Net income $2,618 a. Compute return on net operating assets (RNOA). Assume a statutory tax rate of 22%. Note: 1. Select the appropriate numerator and denominator used to compute RNOA from the drop-down menu options. 2. Enter the numerator and denominator amounts to compute 2018 RNOA. Numerator Denominator RNOA Answer Answer Answer Answer b. Disaggregate RNOA into components of profitability (NOPM) and productivity (NOAT). Assume a…Kincaid Company reported the following data (in millions) for the past two years:2019 2018$$$$$2801501304090$$$$$2501401103575Net revenues........................................Cost of goods sold...............................Gross profit..........................................Operating expenses..............................Operating income................................In a vertical analysis of 2019, the operating expenses percentage is closest toa. 225%.b. 69%.c. 14%.d. 32%.