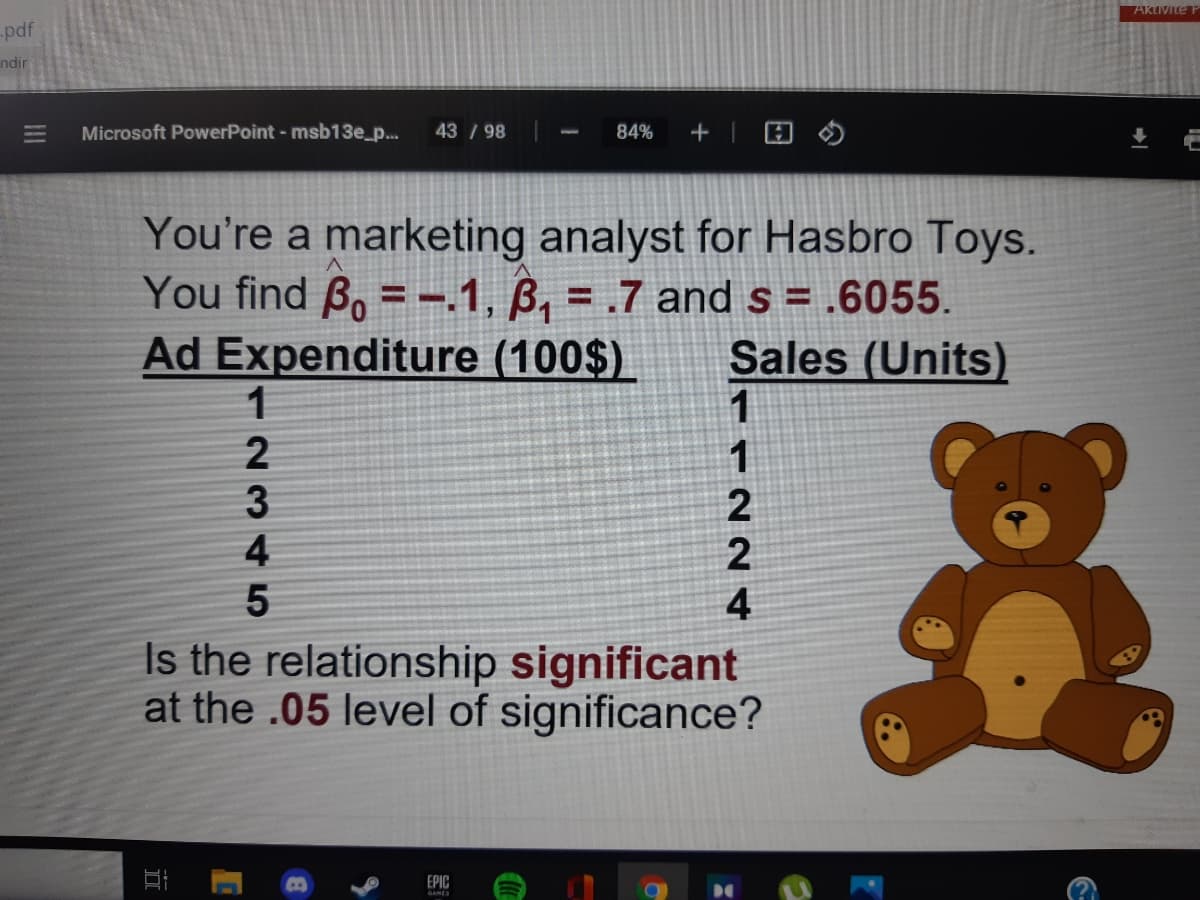
You're a marketing analyst for Hasbro Toys. You find B, =-.1, B, = .7 and s = .6055. Ad Expenditure (100$) %3D Sales (Units) 3 4 Is the relationship significant at the .05 level of significance? 1122N 4


Q: Let x be the average number of employees in a group health insurance plan, and let y be the average…
A: a) From the provided information, The scatterplot for the variables can be constructed as follow:…
Q: 26 Which of the following is a possible value of (r²) and indicates the strongest linear…
A: In question, we'll discuss the interpretation of r^2.
Q: Q2: A scientist wanted to see the association between shrimp length and its weight. He carried out…
A: (a) Use EXCEL to obtain the value correlation coefficient r: EXCEL procedure: Go to EXCEL Go…
Q: (a) Make a scatter diagram of the data and visualize the line you think best fits the data. 1000 140…
A: Given, X Y 1004 40 975 100 992 65 935 145 985 77 928 148 Formula: r=bxy×byx…
Q: How much should a healthy Shetland pony weigh? Let x be the age of the pony (in months), and let y…
A: We can analyze the numerical data by using graphical techniques. We can visually display,…
Q: You decide to represent the relationship between the number of cases of wine sold and the price of a…
A:
Q: The total cost of admission to an amusement park, y, is based on the numbe. of tickets purchased, x.…
A: Given: y denotes the total cost of admission to an amusement park. x denotes the number of tickets…
Q: suppose you are given the four correlation coefficient values below. Determine which one represents…
A:
Q: 4. Is there any relationship between the math and science scores of the following 5 people? Person…
A:
Q: When Melanie left her house in the morning, her cell phone battery was partially charged. Let B…
A:
Q: Vineyards again Instead of Age, perhaps the Size of thevineyard (in acres) is associated with the…
A: Solution: a) From a scatter plot, we can observe that the points do not appear tightly clustered in…
Q: Which of the following r-values indicates the strongest relationship between two variables? - 0.89
A: We know that Correlation coefficient is said to be in strong relationship when it is near to 1 or…
Q: service with income 800. Find the correlation coefiicient. Select one: а. 0.29 b. 0.36 С. О.75 d.…
A:
Q: (a) Make a scatter diagram of the data. Then visualize the line you think best fits the data. (b)…
A: The scatter plot can be drawn as:
Q: A pediatrician wants to determine the relation that may exist between a child's height and head…
A: The given data is Height, x Head circumference, y 27 17.5 27.5 17.5 26.75 17.3 26.5 17.3…
Q: Here are the world record race times for women in the 10,000-meter run over several years. a) Which…
A: d) The regression analysis is conducted here by using EXCEL. The software procedure is given below:…
Q: o perform a test to determine whether we have a significant linear relationship using an F test,…
A: To test the significance linear relationship between the variables analysis of variance (ANOVA) is…
Q: The marketing research department for a computer company used a large city to test market the firm's…
A:
Q: For the scatterplot shown below, what y value would you expect to be paired with x = 9? 800 700 600…
A: We have given a scatterplot . And have to find What value would we expect to be paired with x=9 ?…
Q: Let x be the average number of employees in a group health insurance plan, and let y be the average…
A: Correlation coefficient: Correlation coefficient is used to measures strength of the association…
Q: ABC Inc. is trying to predict sales (Y) based on marketing budget (X) Use the data below to…
A:
Q: Get 14 days weather forecast for your region including temperature and the percentage of humidity…
A: a) The variance of X can be obtained as: The variance of Y can be obtained as: The variance of X…
Q: c. What percentage of the variation in final scores is explained by the linear relationship between…
A:
Q: The director of an alumni association for a small college wants to determine whether there is any…
A: Let the independent variable X be the years Let the dependent variable Y be the contribution…
Q: No Y; X; 54 47 8. 41 4 35 9. 5 28 11 17 12 For the data in the table Yi = 83, 8- 5, 2.X; Whether the…
A: Hello. Since your question has multiple sub-parts, we will solve first three sub-parts for you. If…
Q: You are presented with the linear model fitted to the following data ses S7SK STOK 565k- S45k Years…
A: Given a chart of linear model fitted to the data. We have to choose the correct option based on the…
Q: Comment on the nature of the relationship. There appears to be (Choose one) between the number of…
A: Here variable y = dependent variable = no of points x = independent variable = no of wins
Q: The number of people who visited the local swimming pool on several days in July were recorded. Does…
A: Here, we can see in the figure, temperature and number of people both are in positive trend.
Q: At a large department store customers were asked to rate the service and the materials purchased on…
A: The hypotheses can be constructed as: H0: ρ = 0 (there is no relationship between the rating and the…
Q: A MLR model is built to predict the Sales Price of a home (Y) from: Assessed Value (X1) Whether…
A: If a regression line has one independent variable it is known as simple linear regression. If the…
Q: The data in the figure below represents the number of stars earned by 140 performers in a talent…
A: Given , Total performers= 140 and the percentage of the performers earned exactly 0…
Q: A random sample of 57 recordings gives the following information. The intercept = 15.24 and the…
A: Given: sample size, n= 57 Intercept, a = 15.24 slope, b = 1.61
Q: Look at the data below regarding the variables x = lowest barometric pressure as a cyclone…
A: b) The hypotheses are given below: Null hypothesis: H0: ρ= 0 Alternative hypothesis: Ha: ρ ≠ 0.…
Q: ABC Inc. Is trying to predict sales (Y) based on marketing budget (X Use the data below to calculate…
A:
Q: dxdy = 125 Ox = 5 O a. Very low degree of corre O b. No correlation O C. Perfect correlation
A: Correlation = ∑dxdynσxσy =125605*7 =0.05
Q: Q5) Fit a straight line to the data given below. Also estimate the value of y at x=2.5. Ans. y=4.045
A:
Q: Describe the relationship of the factors using the plot below. 40 20 12 hrs 18 hrs 1.0 2.0 Medium *…
A: An interaction plot is used to show the relationship between one categorical factor and response…
Q: Here is a bar graph displayed on Fox News in April 13. The relative heights of the bars seem to…
A: Given information: A bar graph is given.
Q: the relationship between concert seating capacity and revenue in $000 for a sample af The rock group…
A: Given that the rock group Blue String is touring the united states. And the given chart shows the…
Q: There is another research on the relationship between average daily earnings and age. ADE = -15 +…
A: Note: "Since you have posted multiple questions, we will solve the first question for you. If you…
Q: The table below gives the amount of time students in a class studied for a test and their test…
A: Use EXCEL to obtain the value correlation coefficient r: EXCEL procedure: Go to EXCEL Go to…
Q: Tammy kept track of the shoe size of expectant mothers and the weights of their newborns. She…
A:
Q: Ocean currents are important in studies of climate change, as well as ecology studies of dispersal…
A: Given values, Σx = 476, Σy = 87.1, Σx2 = 62,290, Σy2 = 2046.87, Σxy = 11121.3,and r ≈ 0.94367.…
Q: Kenneth is studying the relationship between the time spent exercising per day and the time spent…
A: The time spent outside depends on the time of the exercise, that means the time spent outside is…
Q: V). Make a scatterplot for the data. Time Studying (x) 40 50 60 70 80 90 100 110 Score (y) 2 3 6. 7…
A: Use an Excel spreadsheet to create a scatterplot. 1. Enter the data. 2. Select the data and go to…
Q: 2323923 Mr. Thomas wanted to know if the amount of class time that he gave students to study…
A: Correlation studies and measures the direction and intensity of relationship amoung variables. The…
Q: (a) Suppose that this equation describes the actual relationship. What mean yield corresponds to a…
A: The regression equation is given by y = 415.11 - 6.6x1 - 4.50x2 + e
Q: Which of the following is a possible value of r² and indicates the strongest linear relationship…
A: We have given that the statement about to the correlation coefficient between the two variables X…
Q: The Grade 10 Life Orientation teacher has planned a trip for learners of Valley Vista High School to…
A:


Trending now
This is a popular solution!

Step by step
Solved in 3 steps with 5 images

- A random sample of 30 colleges from Kiplinger’s list of the best values in private collegeprovided the data shown in the DATAfile named BestPrivateColleges (Kiplinger, October2013). The variable named Admit Rate (%) shows the percentage of students that appliedto the college and were admitted, and the variable named 4-yr grad. Rate (%) shows thepercentage of students that were admitted and graduated in four years.a. Develop a scatter diagram with Admit Rate (%) as the independent variable. Whatdoes the scatter diagram indicate about the relationship between the two variables?The accompanying technology output was obtained by using the paired data consisting of foot lengths (cm) and heights (cm) of a sample of 40 people. Along with the paired sample data, the technology was also given a foot length of 23.5 cm to be used for predicting height. The technology found that there is a linear correlation between height and foot length. If someone has a foot length of 23.5 cm, what is the single value that is the best predicted height for that person? The single value that is the best predicted height is _____cm. The regression equation is Height=50.8+3.20 Foot Length Predictor Coef SE Coef T P Constant 50.82 11.65 4.36 0.000 Foot Length 3.1982 0.4903 6.52 0.000 S=5.50372 R-Sq=71.7% R-Sq(adj)=71.0% Predicted Values for New Observations New Obs Fit SE Fit 95% CI 95% PI 1 125.978 1.744 (121.356, 130.600) (114.681, 137.275) Values of Predictors…In a random sample of seven statistics students, the number of homework assignments missed (x) and the score on Exam #3 (y) were recorded. Use the (abbreviated) MINITAB output below to test for significant negative correlation between the number of homework assignments missed and the score on Exam #3 at the 1% level of significance. State hypotheses and conclusions.Pearson correlation of x and y = -0.935
- A community college professor is interested in determining the relationship between the number of posts students make on Schoology and their respective grades. He planned to correlate the results from a sample from all his classes, however, due to time constraints, he decided to sample only from students with high grades. As his statistical consultant, state whether or not you support his plans and why.Many small restaurants in Portland, Oregon, and other cities across the United States do not take reservations. Owners say that with smaller capacity, no-shows are costly, and they would rather have their staff focused on customer service rather than maintaining a reservation system. However, it is important to be able to give reasonable estimates of waiting time when customers arrive and put their names on the waiting list. The file RestaurantLine contains 10 observations of number of people in line ahead of a customer (independent variable x) and actual waiting time (dependent variable y). The estimated regression equation is: ŷ=7.82+8.84x and MSE=113.9197. Point estimate for customers with 3 people on the waitlist is 34.3 minutes. b. Develop a 95% confidence interval for the mean waiting time for a customer who arrives with three customers already in line (to 2 decimals). c. Develop a 95% prediction interval for Roger and Sherry Davy's waiting time if there are three customers in…Many small restaurants in Portland, Oregon, and other cities across the United States do not take reservations. Owners say that with smaller capacity, no-shows are costly, and they would rather have their staff focused on customer service rather than maintaining a reservation system. However, it is important to be able to give reasonable estimates of waiting time when customers arrive and put their name on the waiting list. The file RestaurantLine contains 10 observations of number of people in line ahead of a customer (independent variable x) and actual waiting time (dependent variable y). The estimated regression equation is: ŷ=4.35+8.81x and MSE=94.4236. Point Estimate for customers who arrive with 3 people on the wait list is 30.8 minutes. a. Develop a 95% confidence interval for the mean waiting time for a customer who arrives with three customers already in line (to 2 decimals). b. Develop a 95% prediction interval for Roger and Sherry Davy's waiting time if there are three…
- Many small restaurants in Portland, Oregon, and other cities across the United States do not take reservations. Owners say that with smaller capacity, no-shows are costly, and they would rather have their staff focused on customer service rather than maintaining a reservation system.† However, it is important to be able to give reasonable estimates of waiting time when customers arrive and put their name on the waiting list. The file RestaurantLine contains 10 observations of number of people in line ahead of a customer (independent variable x) and actual waiting time (in minutes) (dependent variable y). The estimated regression equation is: ŷ = 4.35 + 8.81x and MSE = 94.42. (a) Develop a point estimate (in min) for a customer who arrives with seven people on the wait-list. (Round your answer to two decimal places.) ŷ* = _____min (b) Develop a 95% confidence interval for the mean waiting time (in min) for a customer who arrives with seven customers already in line. (Round…Which of the following can cause OLS estimators to be biased? PLEASE EXPLAIN. A sample correlation coefficient of .95 between two Independent variablesboth included in the model.In the decoration department of a company 4 people work per shift, the production supervisors remain fixed in their shift while the staff is rotating the schedule, so that they work with both supervisors.For the annual evaluation, each supervisor evaluates everyone's performance.Determine if there is a significant correlation between the two evaluations with alpha= 5%. Worker Supervisor Qualification1 Supervisor Qualification2
- According to World Health Organization (WHO), the recommended limit for a noise level inside a classroom is 35 dBA. However, nine out of ten schools fail to meet this recommendation. A researcher wishes to conduct a study relevant to the prior information, but as a gap, he decides to include the area (in square meters) of every classroom and how it could possibly affect the resulting noise level. He selects 17 classrooms at random, and the noise levels are recorded in the next slide. Calculate the correlation coefficient and interpret the result.The U.S. Census Bureau computes quarterly vacancy and homeownership rates by state and metropolitan statistical area. Each metropolitan statistical area has at least one urbanized area of 50,000 or more inhabitants. The data in Sheet 10 are the rental vacancy rates (%) for metropolitan statistical area in four geographic regions of the U.S. for the first quarter of 2008. Use alpha = 0.05 to test whether the mean vacancy rate is the same for each geographic region. Sheet 10 Midwest Northeast South West 16,2 2,7 16,6 7,9 10,1 11,5 8,5 6,6 8,6 6,6 12,1 6,9 12,3 7,9 9,8 5,6 10 5,3 9,3 4,3 16,9 10,7 9,1 15,2 16,9 8,6 5,6 5,7 5,4 5,5 9,4 4 18,1 12,7 11,6 12,3 11,9 8,3 15,6 3,6 11 6,7 18,3 11 9,6 14,2 13,4 12,1 7,6 1,7 6,5 8,7 12,9 3,6 11,4 5 12,2 11,5 13,1 4,7 13,6 16,3 4,4 3,3 8,2 3,4 24 5,5 12,2 22,6 12 14,5 12,6 9,5 10,1 Select one: a) Sum of Squares Between Groups = 376.87 >…The director of an obesity clinic in a large northwestern city believes that drinking soft drinks contribute to obesity in children. To determine whether a relationship exists between these two variables, she conducts the following pilot study. Eight- 12-year-old male volunteers are randomly selected from children attending a local junior high school. Parents of the children are asked to monitor the number of soft drinks consumed by their child over a one week period. The children are weighed at the end of the week and their weights converted into body mass index (BMI) values. The BMI is a common index used to measure obesity and takes into account both height and weight. An individual is considered obese if they have a BMI value 30. The following data or collected: child. # of soft drinks consumed BMI 1 3 20 2 1 18 3…


