ZyBooks Catalo ypothesis tests for the difference between two population means Jump to level 1 An online math tutor service would like to claim that the average time spent taking a standardized test after students go through tutoring is less than the average time spent before going through tutoring. A simple random sample of students takes a pre-test, then goes through tutoring and takes a post-test. Results of the sample are shown below. What are the population parameters? Mean Variance Before After 79.278 75.556 126.448 125.203 18 Observations 18 Pick Pearson Correlation 0.521 0 Hypothesized Mean Difference Is the two-sample hypothesis test a paired t-test or an unpaired t-test? df 17 t Stat -1.438 P(T
ZyBooks Catalo ypothesis tests for the difference between two population means Jump to level 1 An online math tutor service would like to claim that the average time spent taking a standardized test after students go through tutoring is less than the average time spent before going through tutoring. A simple random sample of students takes a pre-test, then goes through tutoring and takes a post-test. Results of the sample are shown below. What are the population parameters? Mean Variance Before After 79.278 75.556 126.448 125.203 18 Observations 18 Pick Pearson Correlation 0.521 0 Hypothesized Mean Difference Is the two-sample hypothesis test a paired t-test or an unpaired t-test? df 17 t Stat -1.438 P(T

Chapter9: Sequences, Probability And Counting Theory
Section9.7: Probability
Problem 4SE: What is the difference between events and outcomes? Give an example of both using the sample space...

Related questions
Question
Transcribed Image Text:zyBooks catalog
BOOKS
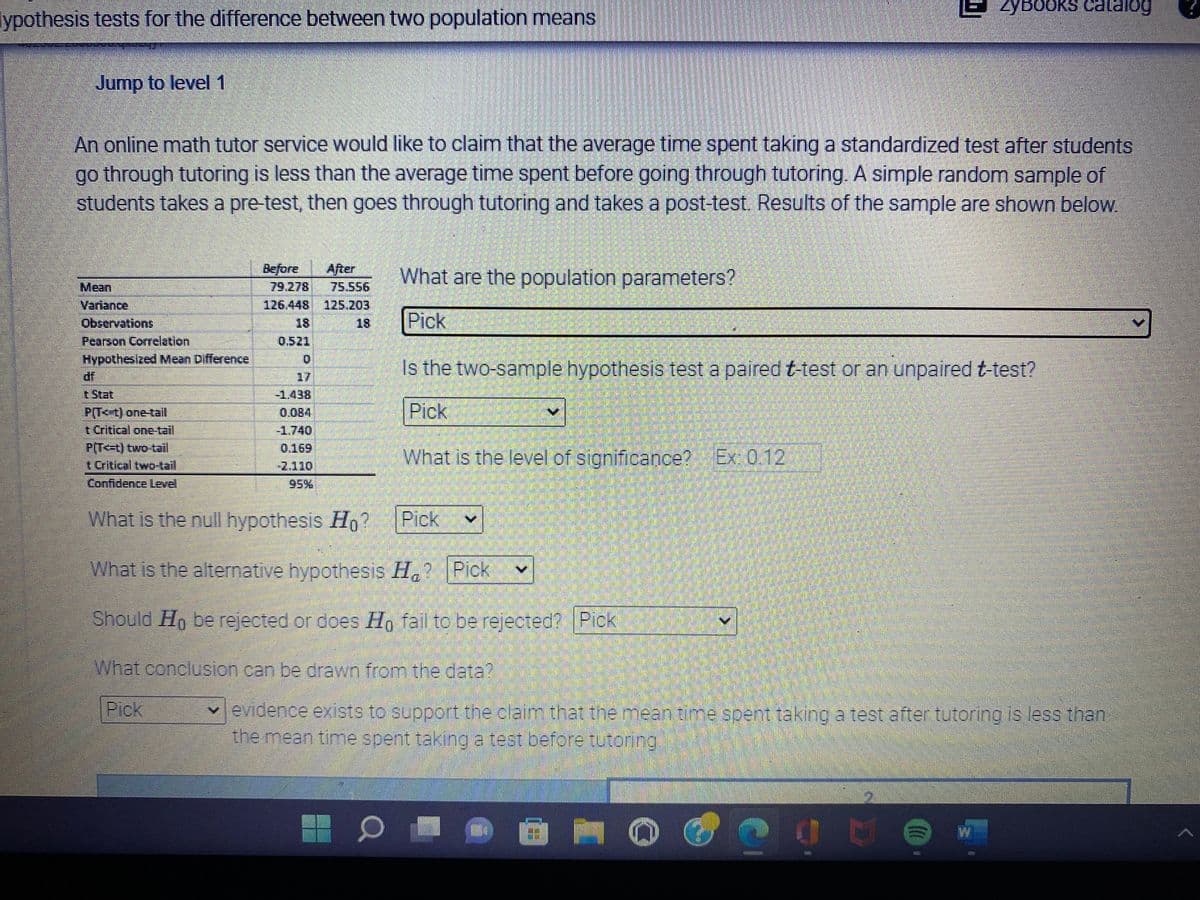
lypothesis tests for the difference between two population means
Jump to level 1
An online math tutor service would like to claim that the average time spent taking a standardized test after students
go through tutoring is less than the average time spent before going through tutoring. A simple random sample of
students takes a pre-test, then goes through tutoring and takes a post-test. Results of the sample are shown below.
Before
What are the population parameters?
75.556
126.448 125.203
Variance
Observations
Pick
V
Pearson Correlation
0.521
Hypothesized Mean Difference
0
Is the two-sample hypothesis test a paired t-test or an unpaired t-test?
t Stat
-1.438
PIT<t) one-tail
0.084
Pick
-1.740
t Critical one-tail
PT<-t) two tail
What is the level of significance? Ex: 0.12
1 Critical two-tail
2.110
Confidence Level
What is the null hypothesis Ho? Pick
What is the alternative hypothesis Ha? Pick
Should Ho be rejected or does Ho fail to be rejected? Pick
What conclusion can be drawn from the data?
Pick
✓evidence exists to support the claim that the mean time spent taking a test after tutoring is less than
the mean time spent taking a test before tutoring
D
Expert Solution
This question has been solved!
Explore an expertly crafted, step-by-step solution for a thorough understanding of key concepts.

Step by step
Solved in 2 steps with 2 images

Recommended textbooks for you

College Algebra (MindTap Course List)
Algebra
ISBN:
9781305652231
Author:
R. David Gustafson, Jeff Hughes
Publisher:
Cengage Learning
College Algebra (MindTap Course List)
Algebra
ISBN:
9781305652231
Author:
R. David Gustafson, Jeff Hughes
Publisher:
Cengage Learning