y T Cell Count and HIV Infection 1200 Asymptomatic Stage Few or no symptoms present. 1000 800 Symptomatic Stage Symptoms begin or get worse. 600 400 AIDS Clinical Diagnosis 200 y = f(x) 1 2 3 4 6 7 8 9 10 11 Time after Infection (years) Average T Cell Count (per milliliter of blood)
y T Cell Count and HIV Infection 1200 Asymptomatic Stage Few or no symptoms present. 1000 800 Symptomatic Stage Symptoms begin or get worse. 600 400 AIDS Clinical Diagnosis 200 y = f(x) 1 2 3 4 6 7 8 9 10 11 Time after Infection (years) Average T Cell Count (per milliliter of blood)

Calculus For The Life Sciences
2nd Edition
ISBN:9780321964038
Author:GREENWELL, Raymond N., RITCHEY, Nathan P., Lial, Margaret L.
Publisher:GREENWELL, Raymond N., RITCHEY, Nathan P., Lial, Margaret L.
Chapter1: Functions
Section1.EA: Extended Application Using Extrapolation To Predict Life Expectancy
Problem 6EA

Related questions

Question
1. Use the graph to find f(5)
2. What is the value of x when f(x) =100?
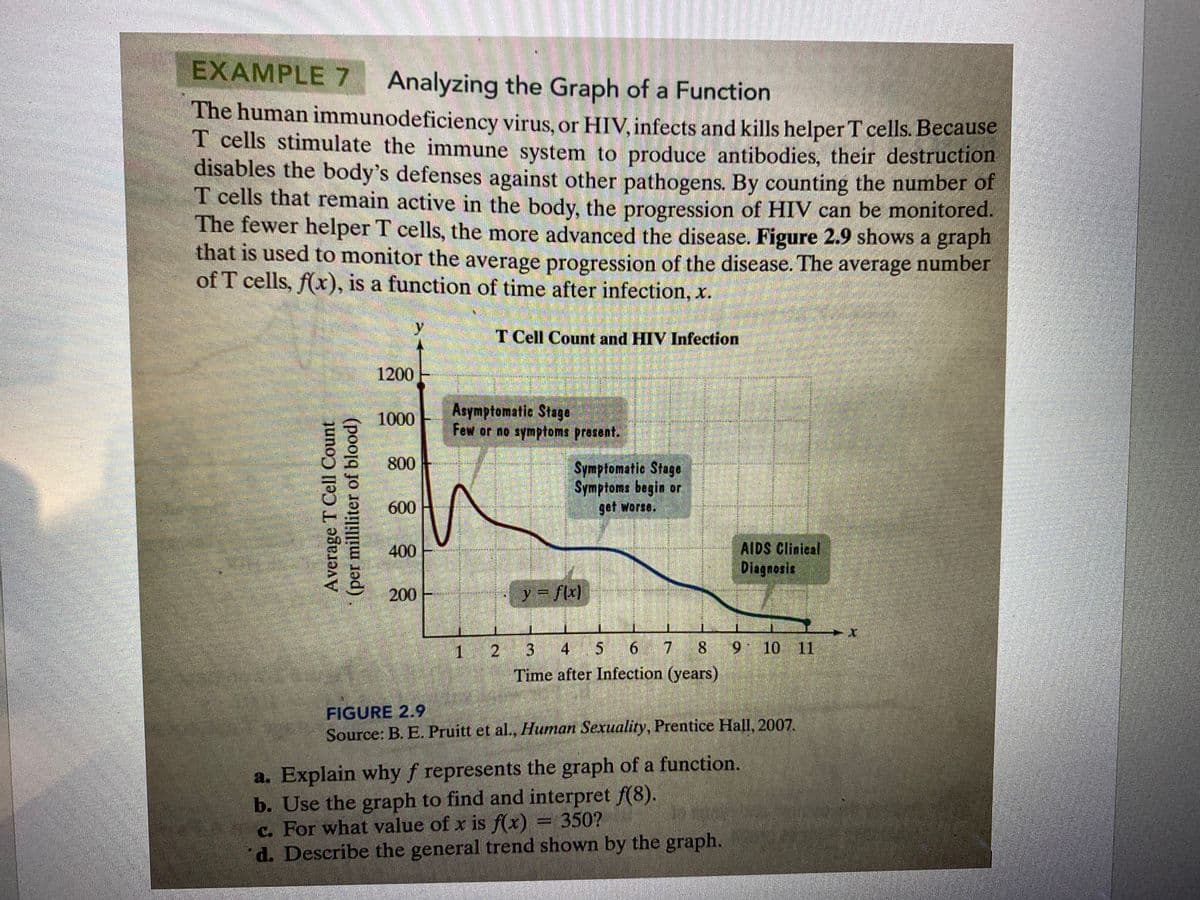
Transcribed Image Text:EXAMPLE 7 Analyzing the Graph of a Function
The human immunodeficiency virus, or HIV, infects and kills helper T cells. Because
T cells stimulate the immune system to produce antibodies, their destruction
disables the body's defenses against other pathogens. By counting the number of
T cells that remain active in the body, the progression of HIV can be monitored.
The fewer helper T cells, the more advanced the disease. Figure 2.9 shows a graph
that is used to monitor the average progression of the disease. The average number
of T cells, f(x), is a function of time after infection, x.
y
T Cell Count and HIV Infection
1200
Asymptomatic Stage
Few or no symptoms present.
1000
800
Symptomatic Stage
Symptoms begin or
* 600
get worse.
AIDS Clinical
Diagnosis
400
200
y = flx)
1 2
3 4 5 6 7 8
6.
10 11
Time after Infection (years)
FIGURE 2.9
Source: B. E. Pruitt et al., Human Sexuality, Prentice Hall, 2007.
a. Explain why f represents the graph of a function.
b. Use the graph to find and interpret f(8).
c. For what value of x is f(x) = 350?
d. Describe the general trend shown by the graph.
Average T Cell Count
(per milliliter of blood)
Expert Solution
This question has been solved!
Explore an expertly crafted, step-by-step solution for a thorough understanding of key concepts.

This is a popular solution!

Trending now
This is a popular solution!

Step by step
Solved in 2 steps

Knowledge Booster


Learn more about
Need a deep-dive on the concept behind this application? Look no further. Learn more about this topic, algebra and related others by exploring similar questions and additional content below.Recommended textbooks for you
Calculus For The Life Sciences
Calculus
ISBN:
9780321964038
Author:
GREENWELL, Raymond N., RITCHEY, Nathan P., Lial, Margaret L.
Publisher:
Pearson Addison Wesley,

Glencoe Algebra 1, Student Edition, 9780079039897…
Algebra
ISBN:
9780079039897
Author:
Carter
Publisher:
McGraw Hill

Algebra & Trigonometry with Analytic Geometry
Algebra
ISBN:
9781133382119
Author:
Swokowski
Publisher:
Cengage
Calculus For The Life Sciences
Calculus
ISBN:
9780321964038
Author:
GREENWELL, Raymond N., RITCHEY, Nathan P., Lial, Margaret L.
Publisher:
Pearson Addison Wesley,
Glencoe Algebra 1, Student Edition, 9780079039897…
Algebra
ISBN:
9780079039897
Author:
Carter
Publisher:
McGraw Hill
Algebra & Trigonometry with Analytic Geometry
Algebra
ISBN:
9781133382119
Author:
Swokowski
Publisher:
Cengage

Mathematics For Machine Technology
Advanced Math
ISBN:
9781337798310
Author:
Peterson, John.
Publisher:
Cengage Learning,
