What is your conclusion (interpretation) from frequency distribution tables and graphs for the students?
What is your conclusion (interpretation) from frequency distribution tables and graphs for the students?

Holt Mcdougal Larson Pre-algebra: Student Edition 2012
1st Edition
ISBN:9780547587776
Author:HOLT MCDOUGAL
Publisher:HOLT MCDOUGAL
Chapter11: Data Analysis And Probability
Section11.1: Stem-and-leaf Plots And Histograms
Problem 5E

Related questions
Question
100%
What is your conclusion (interpretation) from frequency distribution tables and graphs for the
students?
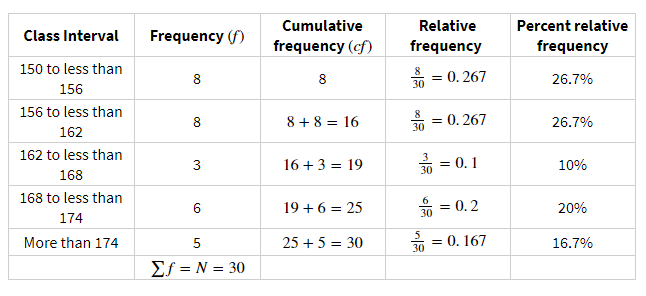
Transcribed Image Text:Cumulative
Relative
Percent relative
Class Interval
Frequency (f)
frequency (cf)
frequency
frequency
150 to less than
8
8
을= 0.267
26.7%
156
156 to less than
8
8 + 8 = 16
30
= 0. 267
26.7%
162
162 to less than
3
16+ 3 = 19
10%
30
168
168 to less than
19 + 6 = 25
음 %= 0.2
20%
174
More than 174
5
25 + 5 = 30
긁= 0.167
16.7%
30
ΣΙ-N 30
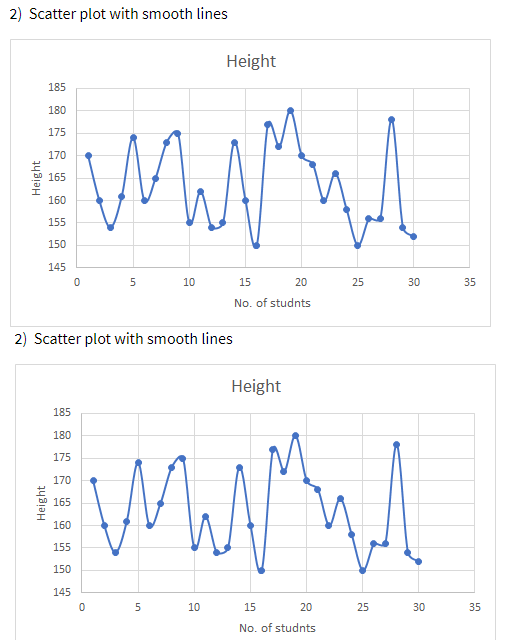
Transcribed Image Text:2) Scatter plot with smooth lines
Height
185
180
WW
175
170
165
160
155
150
145
10
15
20
25
30
35
No. of studnts
2) Scatter plot with smooth lines
Height
185
180
175
170
165
160
155
150
145
10
15
20
25
30
35
No. of studnts
Height
Expert Solution
This question has been solved!
Explore an expertly crafted, step-by-step solution for a thorough understanding of key concepts.

Step by step
Solved in 2 steps

Knowledge Booster


Learn more about
Need a deep-dive on the concept behind this application? Look no further. Learn more about this topic, statistics and related others by exploring similar questions and additional content below.Recommended textbooks for you
Holt Mcdougal Larson Pre-algebra: Student Edition…
Algebra
ISBN:
9780547587776
Author:
HOLT MCDOUGAL
Publisher:
HOLT MCDOUGAL

Big Ideas Math A Bridge To Success Algebra 1: Stu…
Algebra
ISBN:
9781680331141
Author:
HOUGHTON MIFFLIN HARCOURT
Publisher:
Houghton Mifflin Harcourt

Algebra & Trigonometry with Analytic Geometry
Algebra
ISBN:
9781133382119
Author:
Swokowski
Publisher:
Cengage
Holt Mcdougal Larson Pre-algebra: Student Edition…
Algebra
ISBN:
9780547587776
Author:
HOLT MCDOUGAL
Publisher:
HOLT MCDOUGAL
Big Ideas Math A Bridge To Success Algebra 1: Stu…
Algebra
ISBN:
9781680331141
Author:
HOUGHTON MIFFLIN HARCOURT
Publisher:
Houghton Mifflin Harcourt
Algebra & Trigonometry with Analytic Geometry
Algebra
ISBN:
9781133382119
Author:
Swokowski
Publisher:
Cengage

Linear Algebra: A Modern Introduction
Algebra
ISBN:
9781285463247
Author:
David Poole
Publisher:
Cengage Learning

Functions and Change: A Modeling Approach to Coll…
Algebra
ISBN:
9781337111348
Author:
Bruce Crauder, Benny Evans, Alan Noell
Publisher:
Cengage Learning