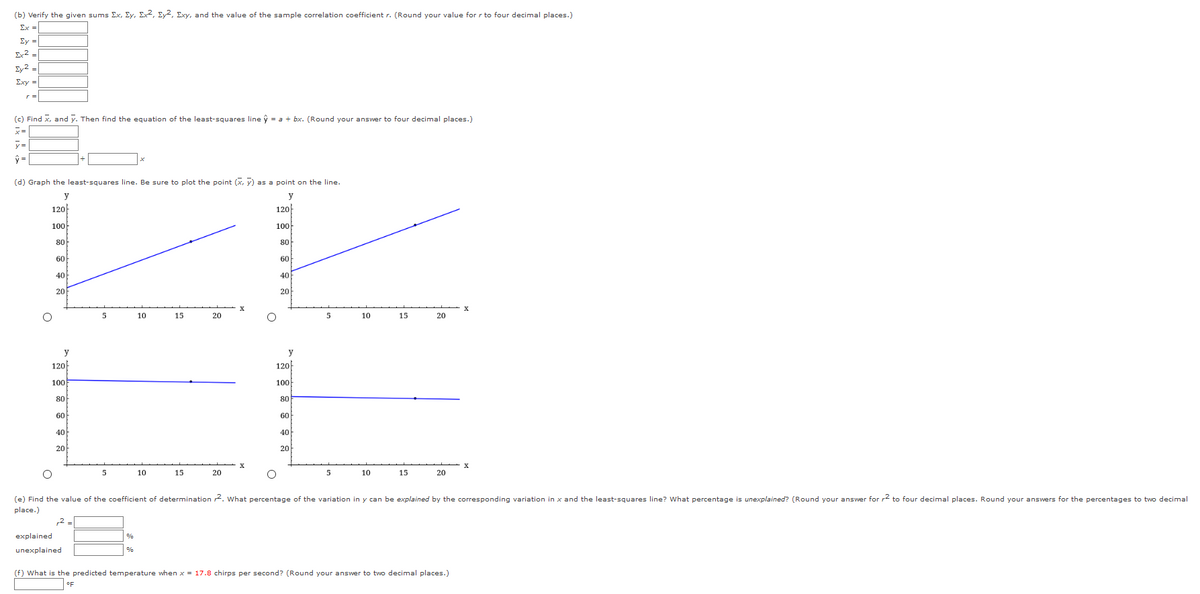
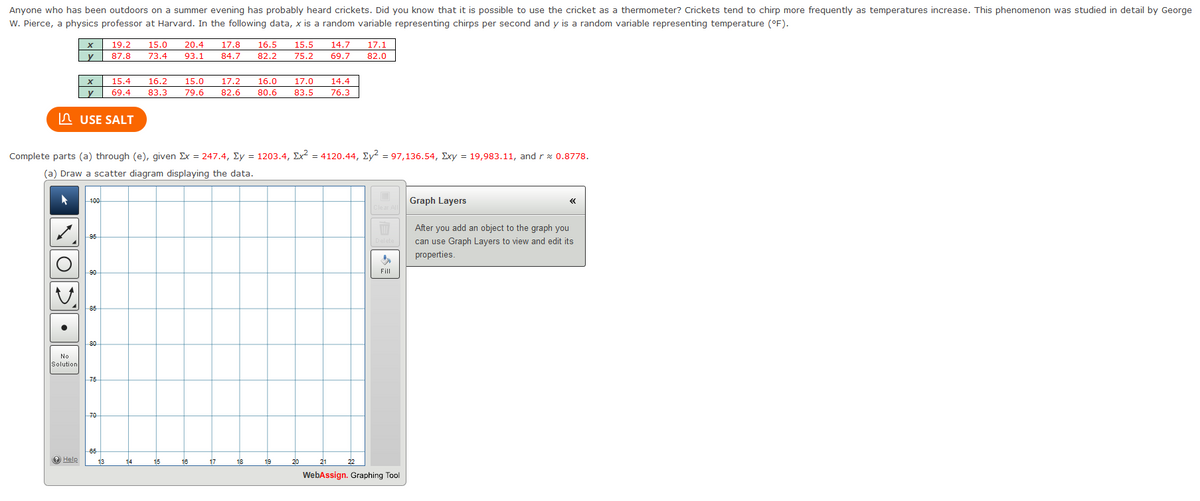
Anyone who has been outdoors on a summer evening has probably heard crickets. Did you know that it is possible to use the cricket as a thermometer? Crickets tend to chirp more frequently as temperatures increase. This phenomenon was studied in detail by George W. Pierce, a physics professor at Harvard. In the following data, x is a random variable representing chirps per second and y is a random variable representing temperature (°F). I need help with (b) (c) (d) (e) and (f)


Contingency Table
A contingency table can be defined as the visual representation of the relationship between two or more categorical variables that can be evaluated and registered. It is a categorical version of the scatterplot, which is used to investigate the linear relationship between two variables. A contingency table is indeed a type of frequency distribution table that displays two variables at the same time.
Binomial Distribution
Binomial is an algebraic expression of the sum or the difference of two terms. Before knowing about binomial distribution, we must know about the binomial theorem.
Anyone who has been outdoors on a summer evening has probably heard crickets. Did you know that it is possible to use the cricket as a thermometer? Crickets tend to chirp more frequently as temperatures increase. This phenomenon was studied in detail by George W. Pierce, a physics professor at Harvard. In the following data, x is a random variable representing chirps per second and y is a random variable representing temperature (°F).
I need help with (b) (c) (d) (e) and (f)


Trending now
This is a popular solution!

Step by step
Solved in 3 steps with 4 images


