Suppose researchers perform a two-tailed study and the following results are obtained. α=0.05 t=2.44 df=40 Use the t-table to decide if there is a statistically significant difference between the data sets.
Suppose researchers perform a two-tailed study and the following results are obtained. α=0.05 t=2.44 df=40 Use the t-table to decide if there is a statistically significant difference between the data sets.

MATLAB: An Introduction with Applications
6th Edition
ISBN:9781119256830
Author:Amos Gilat
Publisher:Amos Gilat
Chapter1: Starting With Matlab
Section: Chapter Questions
Problem 1P

Related questions
Question
Suppose researchers perform a two-tailed study and the following results are obtained.
α=0.05
t=2.44
df=40
Use the t-table to decide if there is a statistically significant difference between the data sets.
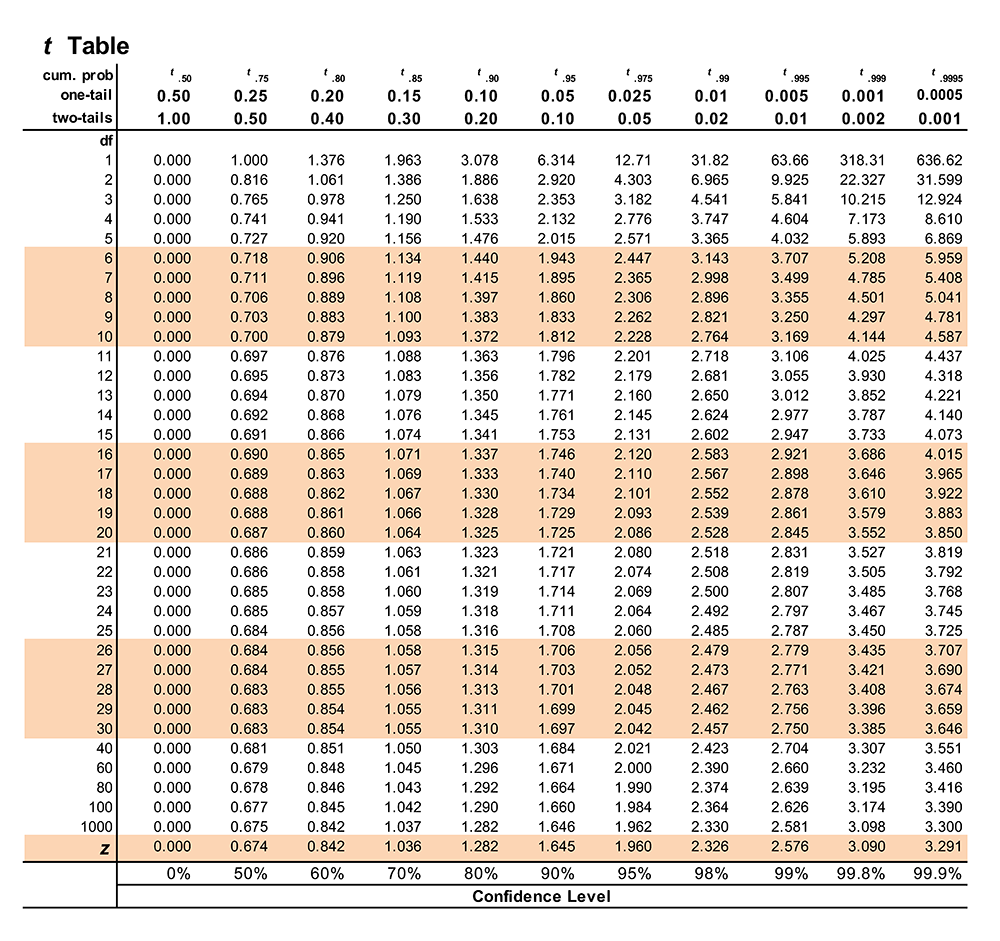
Transcribed Image Text:t Table
cum. prob
one-tail
two-tails
df
1
2
3
4
5
6
7
8
9
10
11
12
13
14
15
16
17
18
19
20
21
22
23
24
25
26
27
28
29
30
40
60
80
100
1000
Z
1.50
0.50
1.00
0.000
0.000
0.000
0.000
0.000
0.000
0.000
0.000
0.000
0.000
0.000
0.000
0.000
0.000
0.000
0.000
0.000
0.000
0.000
0.000
0.000
0.000
0.000
0.000
0.000
0.000
0.000
0.000
0.000
0.000
0.000
0.000
0.000
0.000
0.000
0.000
0%
¹.75
t.80
0.25
0.20
0.50
0.40
1.000
1.376
0.816
1.061
0.765
0.978
0.741
0.941
0.727
0.920
0.718
0.906
0.711
0.896
0.706
0.889
0.703
0.883
0.700
0.879
0.697
0.876
0.695 0.873
0.694
0.870
0.692
0.868
0.691
0.866
0.690
0.865
0.689
0.863
0.688
0.862
0.688
0.861
0.687
0.860
0.686
0.859
0.686
0.858
0.685
0.858
0.685
0.857
0.684
0.856
0.684
0.856
0.684
0.855
0.683
0.855
0.683
0.854
0.683
0.854
0.681
0.851
0.679
0.848
0.678
0.846
0.677
0.845
0.675
0.842
0.674
0.842
50%
60%
t.975
0.025
0.05
12.71
4.303
3.182
2.776
2.571
2.447
2.365
2.306
2.262
2.228
2.201
2.179
2.160
2.145
2.131
2.120
2.110
2.101
2.093
2.086
2.080
2.074
2.069
2.064
2.060
2.056
2.052
2.048
2.045
2.042
2.021
2.000
1.990
1.984
1.962
1.960
95%
.85
1.90
.95
0.15
0.10
0.05
0.30
0.20
0.10
1.963
3.078
6.314
1.386
1.886
2.920
1.250
1.638
2.353
1.190
1.533
2.132
1.156
1.476
2.015
1.134
1.440
1.943
1.119
1.415
1.895
1.108
1.397
1.860
1.100
1.383
1.833
1.093
1.372
1.812
1.088
1.363
1.796
1.083
1.356
1.782
1.079
1.350
1.771
1.076
1.345
1.761
1.074
1.341
1.753
1.071
1.337
1.746
1.069
1.333
1.740
1.067
1.330
1.734
1.066
1.328
1.729
1.064 1.325
1.725
1.063
1.323
1.721
1.061
1.321
1.717
1.060
1.319
1.714
1.059
1.318
1.711
1.058
1.316
1.708
1.058
1.315
1.706
1.057
1.314
1.703
1.056
1.313
1.701
1.055
1.311
1.699
1.055
1.310
1.697
1.050
1.303
1.684
1.045
1.296
1.671
1.043
1.292
1.664
1.042
1.290
1.660
1.037
1.282
1.646
1.036
1.282
1.645
70%
80%
90%
Confidence Level
t.99
0.01
0.02
31.82
6.965
4.541
3.747
3.365
3.143
2.998
2.896
2.821
2.764
2.718
2.681
2.650
2.624
2.602
2.583
2.567
2.552
2.539
2.528
2.518
2.508
2.500
2.492
2.485
2.479
2.473
2.467
2.462
2.457
2.423
2.390
2.374
2.364
2.330
2.326
98%
¹995
t 999
9995
0.005
0.001
0.0005
0.01 0.002 0.001
63.66
318.31
636.62
9.925 22.327
31.599
5.841
10.215
12.924
4.604
7.173
8.610
4.032
5.893
6.869
3.707
5.208
5.959
3.499
4.785
5.408
3.355
4.501
5.041
3.250
4.297
4.781
3.169
4.144
4.587
3.106
4.025
4.437
3.055
3.930
4.318
3.012
3.852
4.221
2.977
3.787
4.140
2.947
3.733
4.073
2.921
3.686
4.015
2.898
3.646
3.965
2.878
3.610
3.922
2.861
3.579
3.883
2.845
3.552
3.850
2.831
3.527
3.819
2.819
3.505
3.792
2.807
3.485
3.768
2.797
3.467
3.745
2.787
3.450
3.725
2.779
3.435
3.707
2.771
3.421
3.690
2.763
3.408
3.674
2.756
3.396
3.659
2.750
3.385
3.646
2.704
3.307
3.551
2.660
3.232
3.460
2.639
3.195
3.416
2.626
3.174
3.390
2.581
3.098
3.300
2.576
3.090
3.291
99% 99.8%
99.9%
Expert Solution
This question has been solved!
Explore an expertly crafted, step-by-step solution for a thorough understanding of key concepts.

This is a popular solution!

Trending now
This is a popular solution!

Step by step
Solved in 2 steps with 2 images

Recommended textbooks for you
MATLAB: An Introduction with Applications
Statistics
ISBN:
9781119256830
Author:
Amos Gilat
Publisher:
John Wiley & Sons Inc

Probability and Statistics for Engineering and th…
Statistics
ISBN:
9781305251809
Author:
Jay L. Devore
Publisher:
Cengage Learning

Statistics for The Behavioral Sciences (MindTap C…
Statistics
ISBN:
9781305504912
Author:
Frederick J Gravetter, Larry B. Wallnau
Publisher:
Cengage Learning
MATLAB: An Introduction with Applications
Statistics
ISBN:
9781119256830
Author:
Amos Gilat
Publisher:
John Wiley & Sons Inc
Probability and Statistics for Engineering and th…
Statistics
ISBN:
9781305251809
Author:
Jay L. Devore
Publisher:
Cengage Learning
Statistics for The Behavioral Sciences (MindTap C…
Statistics
ISBN:
9781305504912
Author:
Frederick J Gravetter, Larry B. Wallnau
Publisher:
Cengage Learning

Elementary Statistics: Picturing the World (7th E…
Statistics
ISBN:
9780134683416
Author:
Ron Larson, Betsy Farber
Publisher:
PEARSON

The Basic Practice of Statistics
Statistics
ISBN:
9781319042578
Author:
David S. Moore, William I. Notz, Michael A. Fligner
Publisher:
W. H. Freeman

Introduction to the Practice of Statistics
Statistics
ISBN:
9781319013387
Author:
David S. Moore, George P. McCabe, Bruce A. Craig
Publisher:
W. H. Freeman