. Below are the number of hours spent by teache and 12 students were selected at random to there is a significant difference on the average Teacher 5 6 4 7
. Below are the number of hours spent by teache and 12 students were selected at random to there is a significant difference on the average Teacher 5 6 4 7

Glencoe Algebra 1, Student Edition, 9780079039897, 0079039898, 2018
18th Edition
ISBN:9780079039897
Author:Carter
Publisher:Carter
Chapter4: Equations Of Linear Functions
Section: Chapter Questions
Problem 8SGR

Related questions
Question
NEED ASAP
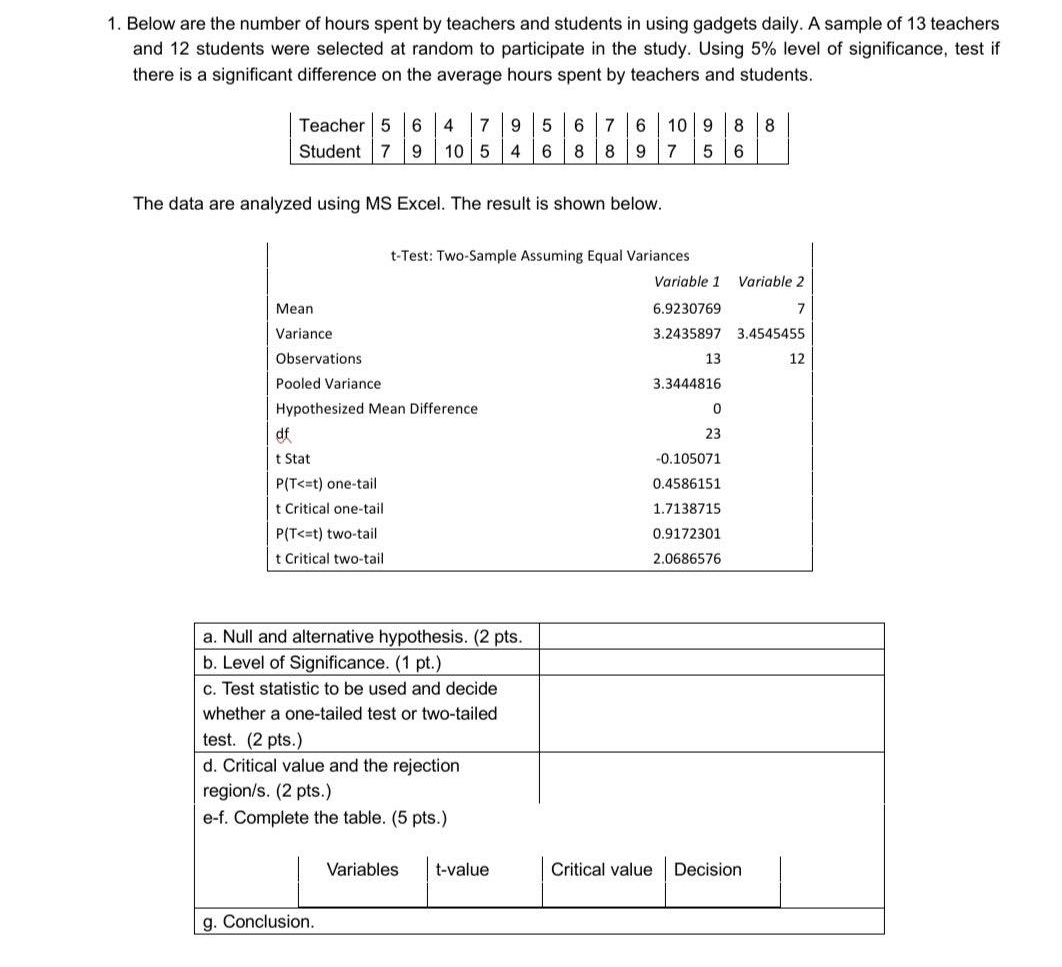
Transcribed Image Text:1. Below are the number of hours spent by teachers and students in using gadgets daily. A sample of 13 teachers
and 12 students were selected at random to participate in the study. Using 5% level of significance, test if
there is a significant difference on the average hours spent by teachers and students.
Teacher 5 6 4 7 9 5 6 7 6 10 9 8 8
Student 7 9 10 5 4 6 8 8 9 7 5 6
The data are analyzed using MS Excel. The result is shown below.
t-Test: Two-Sample Assuming Equal Variances
Variable 1
Variable 2
Mean
6.9230769
7
Variance
3.2435897
3.4545455
Observations.
13
12
Pooled Variance
3.3444816
Hypothesized Mean Difference
0
df
23
t Stat
-0.105071
P(T<=t) one-tail
0.4586151
It Critical one-tail
1.7138715
P(T<=t) two-tail
0.9172301
t Critical two-tail
2.0686576
a. Null and alternative hypothesis. (2 pts.
b. Level of Significance. (1 pt.)
c. Test statistic to be used and decide
whether a one-tailed test or two-tailed
test. (2 pts.)
d. Critical value and the rejection
region/s. (2 pts.)
e-f. Complete the table. (5 pts.)
Critical value Decision
g. Conclusion.
Variables t-value
Expert Solution
This question has been solved!
Explore an expertly crafted, step-by-step solution for a thorough understanding of key concepts.

Step by step
Solved in 2 steps with 2 images

Recommended textbooks for you
Glencoe Algebra 1, Student Edition, 9780079039897…
Algebra
ISBN:
9780079039897
Author:
Carter
Publisher:
McGraw Hill

College Algebra (MindTap Course List)
Algebra
ISBN:
9781305652231
Author:
R. David Gustafson, Jeff Hughes
Publisher:
Cengage Learning
Glencoe Algebra 1, Student Edition, 9780079039897…
Algebra
ISBN:
9780079039897
Author:
Carter
Publisher:
McGraw Hill
College Algebra (MindTap Course List)
Algebra
ISBN:
9781305652231
Author:
R. David Gustafson, Jeff Hughes
Publisher:
Cengage Learning