Project: Historical Temperature Trends (Hypothesis test) Use the following historical data for the annual average temperature records for New York City, USA to answer the following questions. For each year, the data value is calculated by taking the average of the daily high temperature readings from every day of that year, observed in a specific location, e.g., Central Park for New York and Observatory Hill for Sydney. The data are sorted by year in ascending order. For your convenience, temperatures have been converted to the Fahrenheit scale. You can find the data and the original data sources at https://lagcc- cuny.digication.com/project data/Temperature Trends.) For your convenience the EXCEL data files are attached along with the assignment. Q#1) We want to know if the recent temperatures (1989 to 2013) in NYC, has increased compared to temperatures in NYC during 1889 to 1988. We will conduct a hypothesis test to make this decision. Text The average temperature of the NYC for the years between 1889 to 1988 was 52.872 °F. Use t- distribution to conduct the hypothesis test at 5% level of significance to test if the annual average temperature of New York City has increased over the past 25 years. Write your conclusion from the results you obtained. (Hint: Compute the average temperature (x) and the standard deviation (s) from the given data for the last 25 years (1989-2013)).
Project: Historical Temperature Trends (Hypothesis test) Use the following historical data for the annual average temperature records for New York City, USA to answer the following questions. For each year, the data value is calculated by taking the average of the daily high temperature readings from every day of that year, observed in a specific location, e.g., Central Park for New York and Observatory Hill for Sydney. The data are sorted by year in ascending order. For your convenience, temperatures have been converted to the Fahrenheit scale. You can find the data and the original data sources at https://lagcc- cuny.digication.com/project data/Temperature Trends.) For your convenience the EXCEL data files are attached along with the assignment. Q#1) We want to know if the recent temperatures (1989 to 2013) in NYC, has increased compared to temperatures in NYC during 1889 to 1988. We will conduct a hypothesis test to make this decision. Text The average temperature of the NYC for the years between 1889 to 1988 was 52.872 °F. Use t- distribution to conduct the hypothesis test at 5% level of significance to test if the annual average temperature of New York City has increased over the past 25 years. Write your conclusion from the results you obtained. (Hint: Compute the average temperature (x) and the standard deviation (s) from the given data for the last 25 years (1989-2013)).

Glencoe Algebra 1, Student Edition, 9780079039897, 0079039898, 2018
18th Edition
ISBN:9780079039897
Author:Carter
Publisher:Carter
Chapter10: Statistics
Section: Chapter Questions
Problem 27SGR

Related questions
Question
Transcribed Image Text:1234
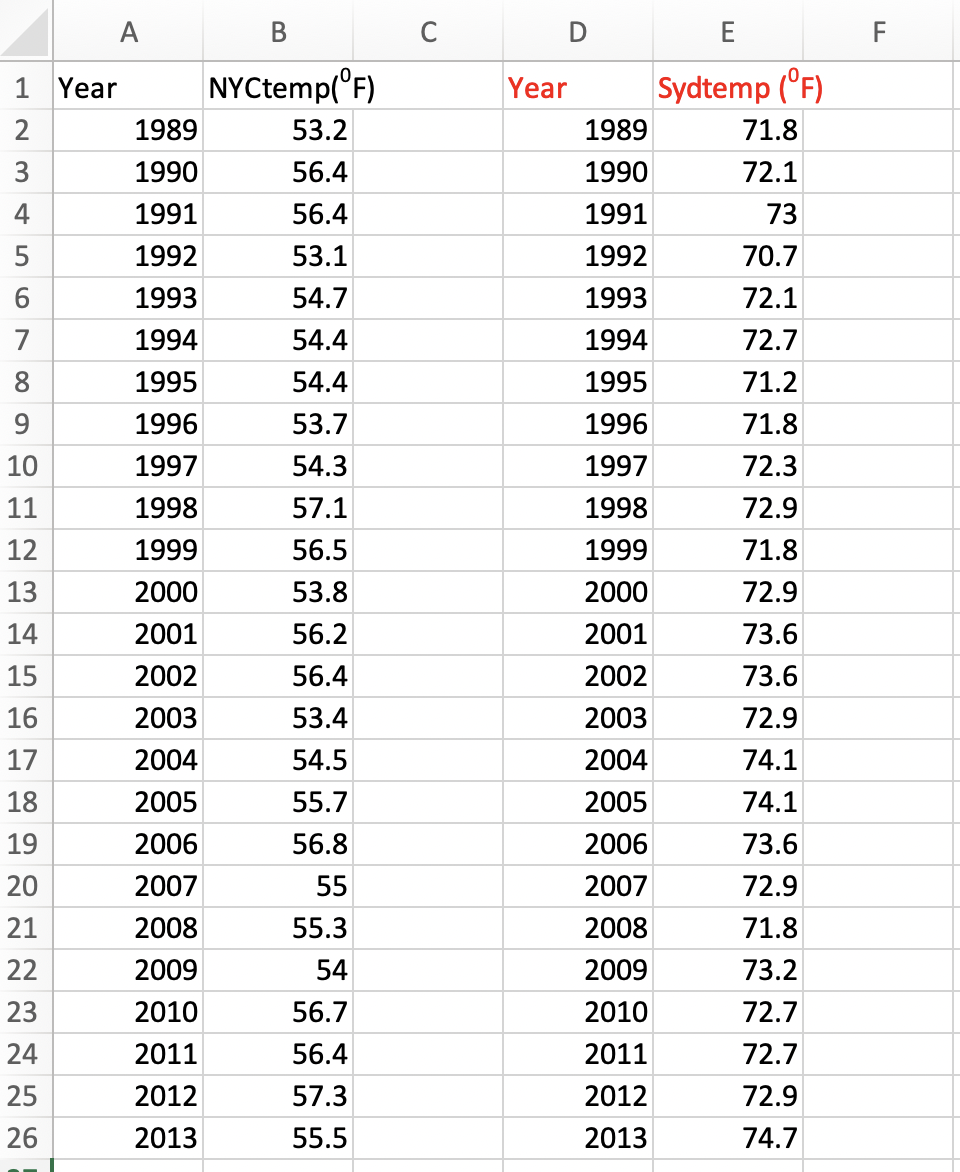
1 Year
5
6
7
8
9
10
11
12
13
14
15
16
17
18
19
20
21
22
23
24
25
26
1989
1990
1991
1992
1993
1994
1995
1996
1997
1998
1999
2000
2001
2002
2003
2004
2005
2006
2007
2008
2009
2010
2011
2012
2013
B
NYCtemp(°F)
53.2
56.4
56.4
53.1
54.7
54.4
54.4
53.7
54.3
57.1
56.5
53.8
56.2
56.4
53.4
54.5
55.7
56.8
55
55.3
54
56.7
56.4
57.3
55.5
C
D
Year
1989
1990
1991
1992
1993
1994
1995
1996
1997
1998
1999
2000
2001
2002
2003
2004
2005
2006
2007
2008
2009
2010
2011
2012
2013
E
Sydtemp (°F)
71.8
72.1
73
70.7
72.1
72.7
71.2
71.8
72.3
72.9
71.8
72.9
73.6
73.6
72.9
74.1
74.1
73.6
72.9
71.8
73.2
72.7
72.7
72.9
74.7
F
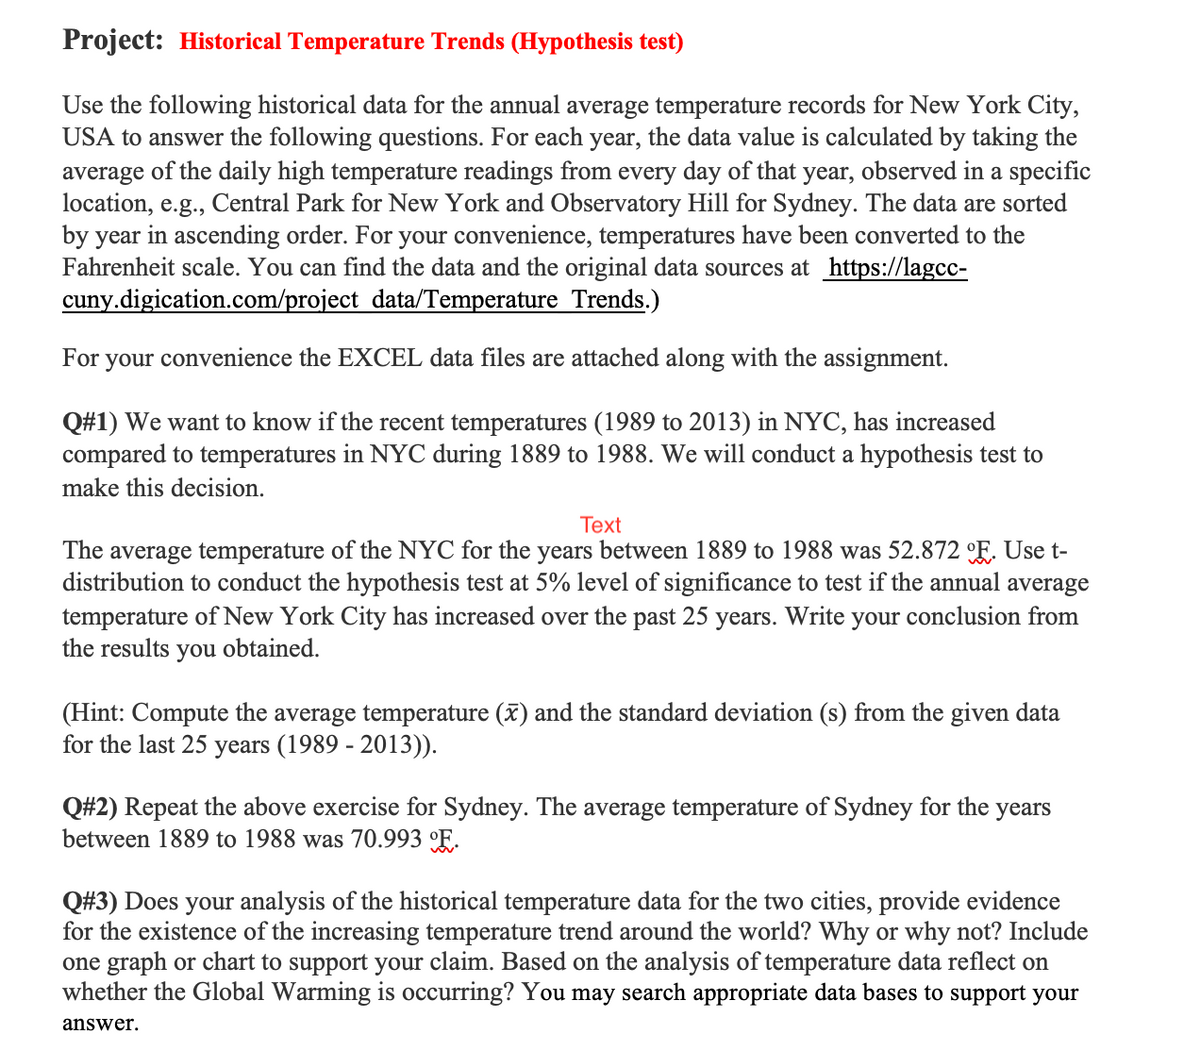
Transcribed Image Text:Project: Historical Temperature Trends (Hypothesis test)
Use the following historical data for the annual average temperature records for New York City,
USA to answer the following questions. For each year, the data value is calculated by taking the
average of the daily high temperature readings from every day of that year, observed in a specific
location, e.g., Central Park for New York and Observatory Hill for Sydney. The data are sorted
by year in ascending order. For your convenience, temperatures have been converted to the
Fahrenheit scale. You can find the data and the original data sources at https://lagcc-
cuny.digication.com/project data/Temperature Trends.)
For your convenience the EXCEL data files are attached along with the assignment.
Q#1) We want to know if the recent temperatures (1989 to 2013) in NYC, has increased
compared to temperatures in NYC during 1889 to 1988. We will conduct a hypothesis test to
make this decision.
Text
The average temperature of the NYC for the years between 1889 to 1988 was 52.872 E. Use t-
distribution to conduct the hypothesis test at 5% level of significance to test if the annual average
temperature of New York City has increased over the past 25
years. Write your conclusion from
the results you obtained.
(Hint: Compute the average temperature (x) and the standard deviation (s) from the given data
for the last 25 years (1989 - 2013)).
Q#2) Repeat the above exercise for Sydney. The average temperature of Sydney for the years
between 1889 to 1988 was 70.993 °F.
Q#3) Does your analysis of the historical temperature data for the two cities, provide evidence
for the existence of the increasing temperature trend around the world? Why or why not? Include
one graph or chart to support your claim. Based on the analysis of temperature data reflect on
whether the Global Warming is occurring? You may search appropriate data bases to support your
answer.
Expert Solution
This question has been solved!
Explore an expertly crafted, step-by-step solution for a thorough understanding of key concepts.

This is a popular solution!

Trending now
This is a popular solution!

Step by step
Solved in 3 steps

Recommended textbooks for you
Glencoe Algebra 1, Student Edition, 9780079039897…
Algebra
ISBN:
9780079039897
Author:
Carter
Publisher:
McGraw Hill

Linear Algebra: A Modern Introduction
Algebra
ISBN:
9781285463247
Author:
David Poole
Publisher:
Cengage Learning

Big Ideas Math A Bridge To Success Algebra 1: Stu…
Algebra
ISBN:
9781680331141
Author:
HOUGHTON MIFFLIN HARCOURT
Publisher:
Houghton Mifflin Harcourt
Glencoe Algebra 1, Student Edition, 9780079039897…
Algebra
ISBN:
9780079039897
Author:
Carter
Publisher:
McGraw Hill
Linear Algebra: A Modern Introduction
Algebra
ISBN:
9781285463247
Author:
David Poole
Publisher:
Cengage Learning
Big Ideas Math A Bridge To Success Algebra 1: Stu…
Algebra
ISBN:
9781680331141
Author:
HOUGHTON MIFFLIN HARCOURT
Publisher:
Houghton Mifflin Harcourt

Holt Mcdougal Larson Pre-algebra: Student Edition…
Algebra
ISBN:
9780547587776
Author:
HOLT MCDOUGAL
Publisher:
HOLT MCDOUGAL