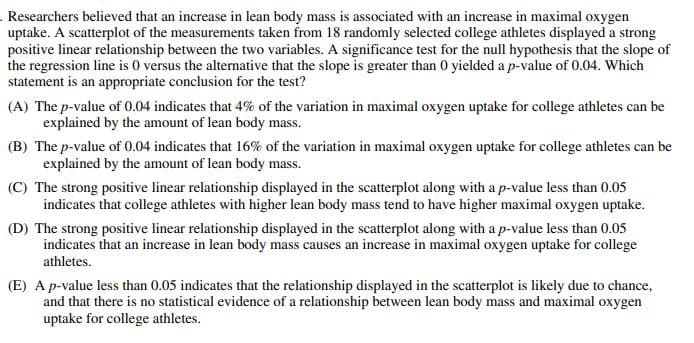
. Researchers believed that an increase in lean body mass is associated with an increase in maximal oxygen uptake. A scatterplot of the measurements taken from 18 randomly selected college athletes displayed a strong positive linear relationship between the two variables. A significance test for the null hypothesis that the slope of the regression line is 0 versus the alternative that the slope is greater than 0 yielded a p-value of 0.04. Which statement is an appropriate conclusion for the test? (A) The p-value of 0.04 indicates that 4% of the variation in maximal oxygen uptake for college athletes can be explained by the amount of lean body mass. (B) The p-value of 0.04 indicates that 16% of the variation in maximal oxygen uptake for college athletes can be explained by the amount of lean body mass. (C) The strong positive linear relationship displayed in the scatterplot along with a p-value less than 0.05 indicates that college athletes with higher lean body mass tend to have higher maximal oxygen uptake. (D) The strong positive linear relationship displayed in the scatterplot along with a p-value less than 0.05 indicates that an increase in lean body mass causes an increase in maximal oxygen uptake for college athletes. (E) A p-value less than 0.05 indicates that the relationship displayed in the scatterplot is likely due to chance, and that there is no statistical evidence of a relationship between lean body mass and maximal oxygen uptake for college athletes.
. Researchers believed that an increase in lean body mass is associated with an increase in maximal oxygen uptake. A scatterplot of the measurements taken from 18 randomly selected college athletes displayed a strong positive linear relationship between the two variables. A significance test for the null hypothesis that the slope of the regression line is 0 versus the alternative that the slope is greater than 0 yielded a p-value of 0.04. Which statement is an appropriate conclusion for the test? (A) The p-value of 0.04 indicates that 4% of the variation in maximal oxygen uptake for college athletes can be explained by the amount of lean body mass. (B) The p-value of 0.04 indicates that 16% of the variation in maximal oxygen uptake for college athletes can be explained by the amount of lean body mass. (C) The strong positive linear relationship displayed in the scatterplot along with a p-value less than 0.05 indicates that college athletes with higher lean body mass tend to have higher maximal oxygen uptake. (D) The strong positive linear relationship displayed in the scatterplot along with a p-value less than 0.05 indicates that an increase in lean body mass causes an increase in maximal oxygen uptake for college athletes. (E) A p-value less than 0.05 indicates that the relationship displayed in the scatterplot is likely due to chance, and that there is no statistical evidence of a relationship between lean body mass and maximal oxygen uptake for college athletes.
College Algebra
7th Edition
ISBN:9781305115545
Author:James Stewart, Lothar Redlin, Saleem Watson
Publisher:James Stewart, Lothar Redlin, Saleem Watson
Chapter1: Equations And Graphs
Section: Chapter Questions
Problem 10T: Olympic Pole Vault The graph in Figure 7 indicates that in recent years the winning Olympic men’s...
Related questions
Question

Transcribed Image Text:. Researchers believed that an increase in lean body mass is associated with an increase in maximal oxygen
uptake. A scatterplot of the measurements taken from 18 randomly selected college athletes displayed a strong
positive linear relationship between the two variables. A significance test for the null hypothesis that the slope of
the regression line is 0 versus the alternative that the slope is greater than 0 yielded a p-value of 0.04. Which
statement is an appropriate conclusion for the test?
(A) The p-value of 0.04 indicates that 4% of the variation in maximal oxygen uptake for college athletes can be
explained by the amount of lean body mass.
(B) The p-value of 0.04 indicates that 16% of the variation in maximal oxygen uptake for college athletes can be
explained by the amount of lean body mass.
(C) The strong positive linear relationship displayed in the scatterplot along with a p-value less than 0.05
indicates that college athletes with higher lean body mass tend to have higher maximal oxygen uptake.
(D) The strong positive linear relationship displayed in the scatterplot along with a p-value less than 0.05
indicates that an increase in lean body mass causes an increase in maximal oxygen uptake for college
athletes.
(E) A p-value less than 0.05 indicates that the relationship displayed in the scatterplot is likely due to chance,
and that there is no statistical evidence of a relationship between lean body mass and maximal oxygen
uptake for college athletes.
AI-Generated Solution
Unlock instant AI solutions
Tap the button
to generate a solution
Recommended textbooks for you

College Algebra
Algebra
ISBN:
9781305115545
Author:
James Stewart, Lothar Redlin, Saleem Watson
Publisher:
Cengage Learning

Glencoe Algebra 1, Student Edition, 9780079039897…
Algebra
ISBN:
9780079039897
Author:
Carter
Publisher:
McGraw Hill

Functions and Change: A Modeling Approach to Coll…
Algebra
ISBN:
9781337111348
Author:
Bruce Crauder, Benny Evans, Alan Noell
Publisher:
Cengage Learning

College Algebra
Algebra
ISBN:
9781305115545
Author:
James Stewart, Lothar Redlin, Saleem Watson
Publisher:
Cengage Learning

Glencoe Algebra 1, Student Edition, 9780079039897…
Algebra
ISBN:
9780079039897
Author:
Carter
Publisher:
McGraw Hill

Functions and Change: A Modeling Approach to Coll…
Algebra
ISBN:
9781337111348
Author:
Bruce Crauder, Benny Evans, Alan Noell
Publisher:
Cengage Learning

Big Ideas Math A Bridge To Success Algebra 1: Stu…
Algebra
ISBN:
9781680331141
Author:
HOUGHTON MIFFLIN HARCOURT
Publisher:
Houghton Mifflin Harcourt