Electric Engineer Co Ltd buys electrical components in batches of 2000. From time to time a batch is randomly selected and, for quality control purposes, all the components are inspected. The data gives the number of defective components found in 90 batches recently bought. 30, 17, 18, 20, 21, 25, 26, 27, 27, 28, 30, 30, 32, 32, 33, 34, 35, 37, 39, 40, 40, 41, 43, 43, 49, 44, 44, 48, 45, 43, 47, 48, 42, 47, 49, 45, 49, 50, 51, 52, 52, 57, 58, 50, 59, 56, 57, 52, 54, 58, 58, 59, 52, 67, 61, 68, 62, 69, 67, 68, 64, 65, 68, 77, 79, 79, 77, 73, 75, 77, 76, 71, 72, 79, 80, 81, 83, 82, 84, 88, 86, 89, 98, 92, 95, 99, 80, 25, 78, 45. (a) Construct a stem and leaf display for the number of defective components. (b) Using the stem and leaf, evaluate the median, lower quartile, upper quartile and the interquartile range of the given distribution. (c) Using graph paper, draw a box and whisker diagram to represent these data and comment on the shape of the distribution. (d) Form a grouped frequency distribution for the number of defective components with classes of equal width of 9 starting with the smallest value. (e) Using the grouped frequency distribution in (d), evaluate an estimate of the mean, variance, standard deviation and the coefficient of variation. (f) Using graph paper, draw a histogram to represent the frequency distribution for the grouped frequency data obtained in (d).
Electric Engineer Co Ltd buys electrical components in batches of 2000. From time to time a batch is randomly selected and, for quality control purposes, all the components are inspected. The data gives the number of defective components found in 90 batches recently bought. 30, 17, 18, 20, 21, 25, 26, 27, 27, 28, 30, 30, 32, 32, 33, 34, 35, 37, 39, 40, 40, 41, 43, 43, 49, 44, 44, 48, 45, 43, 47, 48, 42, 47, 49, 45, 49, 50, 51, 52, 52, 57, 58, 50, 59, 56, 57, 52, 54, 58, 58, 59, 52, 67, 61, 68, 62, 69, 67, 68, 64, 65, 68, 77, 79, 79, 77, 73, 75, 77, 76, 71, 72, 79, 80, 81, 83, 82, 84, 88, 86, 89, 98, 92, 95, 99, 80, 25, 78, 45. (a) Construct a stem and leaf display for the number of defective components. (b) Using the stem and leaf, evaluate the median, lower quartile, upper quartile and the interquartile range of the given distribution. (c) Using graph paper, draw a box and whisker diagram to represent these data and comment on the shape of the distribution. (d) Form a grouped frequency distribution for the number of defective components with classes of equal width of 9 starting with the smallest value. (e) Using the grouped frequency distribution in (d), evaluate an estimate of the mean, variance, standard deviation and the coefficient of variation. (f) Using graph paper, draw a histogram to represent the frequency distribution for the grouped frequency data obtained in (d).

Glencoe Algebra 1, Student Edition, 9780079039897, 0079039898, 2018
18th Edition
ISBN:9780079039897
Author:Carter
Publisher:Carter
Chapter10: Statistics
Section10.3: Measures Of Spread
Problem 1GP

Related questions
Question
100%
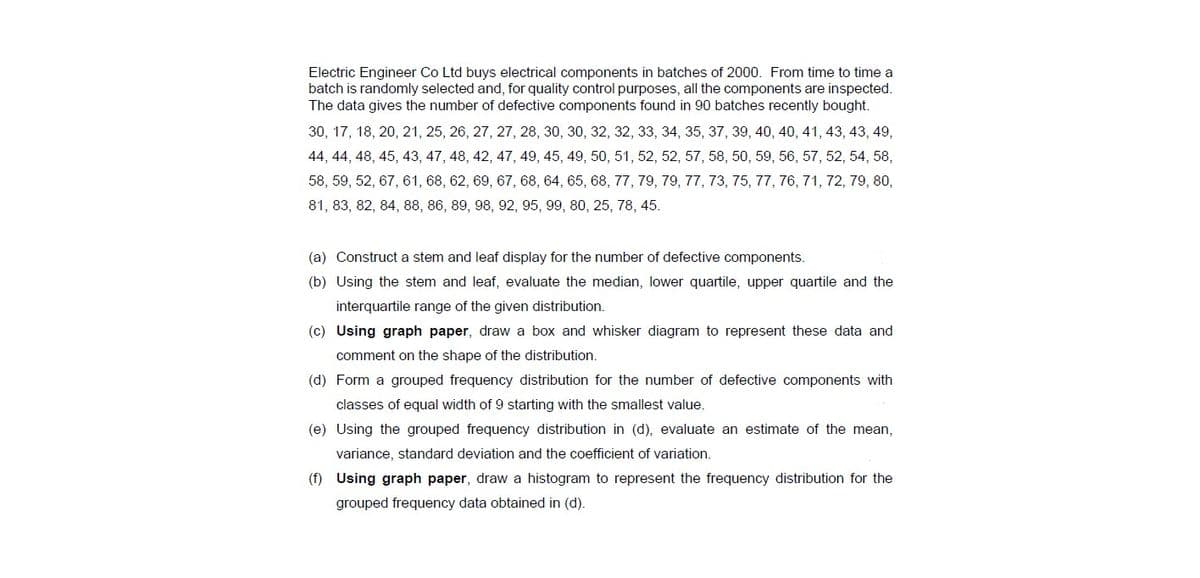
Transcribed Image Text:Electric Engineer Co Ltd buys electrical components in batches of 2000. From time to time a
batch is randomly selected and, for quality control purposes, all the components are inspected.
The data gives the number of defective components found in 90 batches recently bought.
30, 17, 18, 20, 21, 25, 26, 27, 27, 28, 30, 30, 32, 32, 33, 34, 35, 37, 39, 40, 40, 41, 43, 43, 49,
44, 44, 48, 45, 43, 47, 48, 42, 47, 49, 45, 49, 50, 51, 52, 52, 57, 58, 50, 59, 56, 57, 52, 54, 58,
58, 59, 52, 67, 61, 68, 62, 69, 67, 68, 64, 65, 68, 77, 79, 79, 77, 73, 75, 77, 76, 71, 72, 79, 80,
81, 83, 82, 84, 88, 86, 89, 98, 92, 95, 99, 80, 25, 78, 45.
(a) Construct a stem and leaf display for the number of defective components.
(b) Using the stem and leaf, evaluate the median, lower quartile, upper quartile and the
interquartile range of the given distribution.
(c) Using graph paper, draw a box and whisker diagram to represent these data and
comment on the shape of the distribution.
(d) Form a grouped frequency distribution for the number of defective components with
classes of equal width of 9 starting with the smallest value.
(e) Using the grouped frequency distribution in (d), evaluate an estimate of the mean,
variance, standard deviation and the coefficient of variation.
(f) Using graph paper, draw a histogram to represent the frequency distribution for the
grouped frequency data obtained in (d).
Expert Solution
This question has been solved!
Explore an expertly crafted, step-by-step solution for a thorough understanding of key concepts.
Step 1: Write the given information.
VIEWStep 2: Construct stem and leaf diagram for the number of defective components.
VIEWStep 3: Compute median, first quartile, third quartile and interquartile range.
VIEWStep 4: Construct box and whisker diagram for the given data set.
VIEWStep 5: Construct the grouped frequency distribution for the number of defective components.
VIEWStep 6: Compute the mean, variance, standard deviation and the coefficient of variation.
VIEWStep 7: Construct the histogram to represent the frequency distribution for the grouped frequency data.
VIEWSolution
VIEW
Step by step
Solved in 8 steps with 9 images

Recommended textbooks for you
Glencoe Algebra 1, Student Edition, 9780079039897…
Algebra
ISBN:
9780079039897
Author:
Carter
Publisher:
McGraw Hill

College Algebra (MindTap Course List)
Algebra
ISBN:
9781305652231
Author:
R. David Gustafson, Jeff Hughes
Publisher:
Cengage Learning

Holt Mcdougal Larson Pre-algebra: Student Edition…
Algebra
ISBN:
9780547587776
Author:
HOLT MCDOUGAL
Publisher:
HOLT MCDOUGAL
Glencoe Algebra 1, Student Edition, 9780079039897…
Algebra
ISBN:
9780079039897
Author:
Carter
Publisher:
McGraw Hill
College Algebra (MindTap Course List)
Algebra
ISBN:
9781305652231
Author:
R. David Gustafson, Jeff Hughes
Publisher:
Cengage Learning
Holt Mcdougal Larson Pre-algebra: Student Edition…
Algebra
ISBN:
9780547587776
Author:
HOLT MCDOUGAL
Publisher:
HOLT MCDOUGAL
