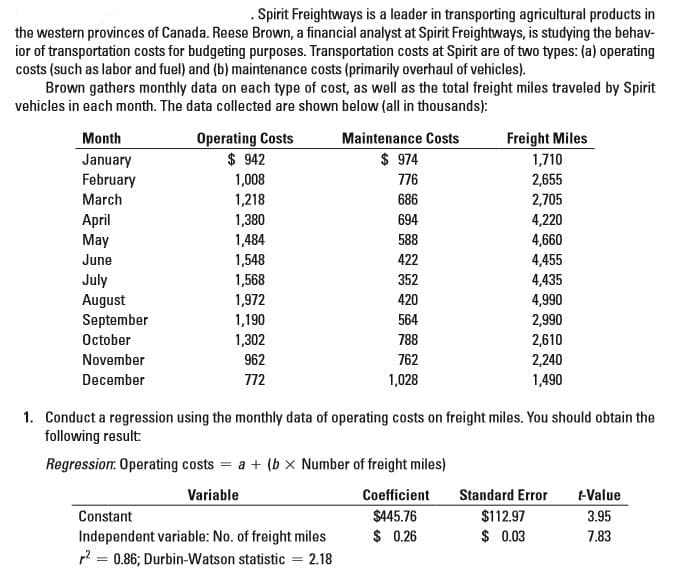
. Spirit Freightways is a leader in transporting agricultural products in the western provinces of Canada. Reese Brown, a financial analyst at Spirit Freightways, is studying the behav- ior of transportation costs for budgeting purposes. Transportation costs at Spirit are of two types: (a) operating costs (such as labor and fuel) and (b) maintenance costs (primarily overhaul of vehicles). Brown gathers monthly data on each type of cost, as well as the total freight miles traveled by Spirit vehicles in each month. The data collected are shown below (all in thousands): Operating Costs $ 942 Month Maintenance Costs Freight Miles $ 974 January February 1,710 1,008 76 2,655 March 1,218 686 2,705 April May 1,380 694 4,220 1,484 588 4,660 June 1,548 422 4,455 4,435 July August September 1,568 352 1,972 420 4,990 1,190 564 2,990 October 1,302 788 2,610 November 962 762 2,240 December 772 1,028 1,490 1. Conduct a regression using the monthly data of operating costs on freight miles. You should obtain the following result: Regression. Operating costs = a + (b x Number of freight miles) Variable Coefficient Standard Error t-Value Constant $445.76 $112.97 3.95 Independent variable: No. of freight miles $ 0.26 $ 0.03 7.83 p2 = 0.86; Durbin-Watson statistic = 2.18 %3D %3D
. Spirit Freightways is a leader in transporting agricultural products in the western provinces of Canada. Reese Brown, a financial analyst at Spirit Freightways, is studying the behav- ior of transportation costs for budgeting purposes. Transportation costs at Spirit are of two types: (a) operating costs (such as labor and fuel) and (b) maintenance costs (primarily overhaul of vehicles). Brown gathers monthly data on each type of cost, as well as the total freight miles traveled by Spirit vehicles in each month. The data collected are shown below (all in thousands): Operating Costs $ 942 Month Maintenance Costs Freight Miles $ 974 January February 1,710 1,008 76 2,655 March 1,218 686 2,705 April May 1,380 694 4,220 1,484 588 4,660 June 1,548 422 4,455 4,435 July August September 1,568 352 1,972 420 4,990 1,190 564 2,990 October 1,302 788 2,610 November 962 762 2,240 December 772 1,028 1,490 1. Conduct a regression using the monthly data of operating costs on freight miles. You should obtain the following result: Regression. Operating costs = a + (b x Number of freight miles) Variable Coefficient Standard Error t-Value Constant $445.76 $112.97 3.95 Independent variable: No. of freight miles $ 0.26 $ 0.03 7.83 p2 = 0.86; Durbin-Watson statistic = 2.18 %3D %3D

Managerial Accounting
15th Edition
ISBN:9781337912020
Author:Carl Warren, Ph.d. Cma William B. Tayler
Publisher:Carl Warren, Ph.d. Cma William B. Tayler
Chapter4: Activity-based Costing
Section: Chapter Questions
Problem 6PB: Product costing and decision analysis for a service company Blue Star Airline provides passenger...

Related questions
Question
Transcribed Image Text:. Spirit Freightways is a leader in transporting agricultural products in
the western provinces of Canada. Reese Brown, a financial analyst at Spirit Freightways, is studying the behav-
ior of transportation costs for budgeting purposes. Transportation costs at Spirit are of two types: (a) operating
costs (such as labor and fuel) and (b) maintenance costs (primarily overhaul of vehicles).
Brown gathers monthly data on each type of cost, as well as the total freight miles traveled by Spirit
vehicles in each month. The data collected are shown below (all in thousands):
Operating Costs
$ 942
Month
Maintenance Costs
Freight Miles
$ 974
January
February
1,710
1,008
76
2,655
March
1,218
686
2,705
April
May
1,380
694
4,220
1,484
588
4,660
June
1,548
422
4,455
4,435
July
August
September
1,568
352
1,972
420
4,990
1,190
564
2,990
October
1,302
788
2,610
November
962
762
2,240
December
772
1,028
1,490
1. Conduct a regression using the monthly data of operating costs on freight miles. You should obtain the
following result:
Regression. Operating costs = a + (b x Number of freight miles)
Variable
Coefficient
Standard Error
t-Value
Constant
$445.76
$112.97
3.95
Independent variable: No. of freight miles
$ 0.26
$ 0.03
7.83
p2 = 0.86; Durbin-Watson statistic = 2.18
%3D
%3D
Expert Solution
This question has been solved!
Explore an expertly crafted, step-by-step solution for a thorough understanding of key concepts.

This is a popular solution!

Trending now
This is a popular solution!

Step by step
Solved in 2 steps with 1 images

Recommended textbooks for you
Managerial Accounting
Accounting
ISBN:
9781337912020
Author:
Carl Warren, Ph.d. Cma William B. Tayler
Publisher:
South-Western College Pub

Financial And Managerial Accounting
Accounting
ISBN:
9781337902663
Author:
WARREN, Carl S.
Publisher:
Cengage Learning,

Cornerstones of Cost Management (Cornerstones Ser…
Accounting
ISBN:
9781305970663
Author:
Don R. Hansen, Maryanne M. Mowen
Publisher:
Cengage Learning
Managerial Accounting
Accounting
ISBN:
9781337912020
Author:
Carl Warren, Ph.d. Cma William B. Tayler
Publisher:
South-Western College Pub
Financial And Managerial Accounting
Accounting
ISBN:
9781337902663
Author:
WARREN, Carl S.
Publisher:
Cengage Learning,
Cornerstones of Cost Management (Cornerstones Ser…
Accounting
ISBN:
9781305970663
Author:
Don R. Hansen, Maryanne M. Mowen
Publisher:
Cengage Learning

Essentials of Business Analytics (MindTap Course …
Statistics
ISBN:
9781305627734
Author:
Jeffrey D. Camm, James J. Cochran, Michael J. Fry, Jeffrey W. Ohlmann, David R. Anderson
Publisher:
Cengage Learning

Principles of Accounting Volume 2
Accounting
ISBN:
9781947172609
Author:
OpenStax
Publisher:
OpenStax College

Principles of Cost Accounting
Accounting
ISBN:
9781305087408
Author:
Edward J. Vanderbeck, Maria R. Mitchell
Publisher:
Cengage Learning