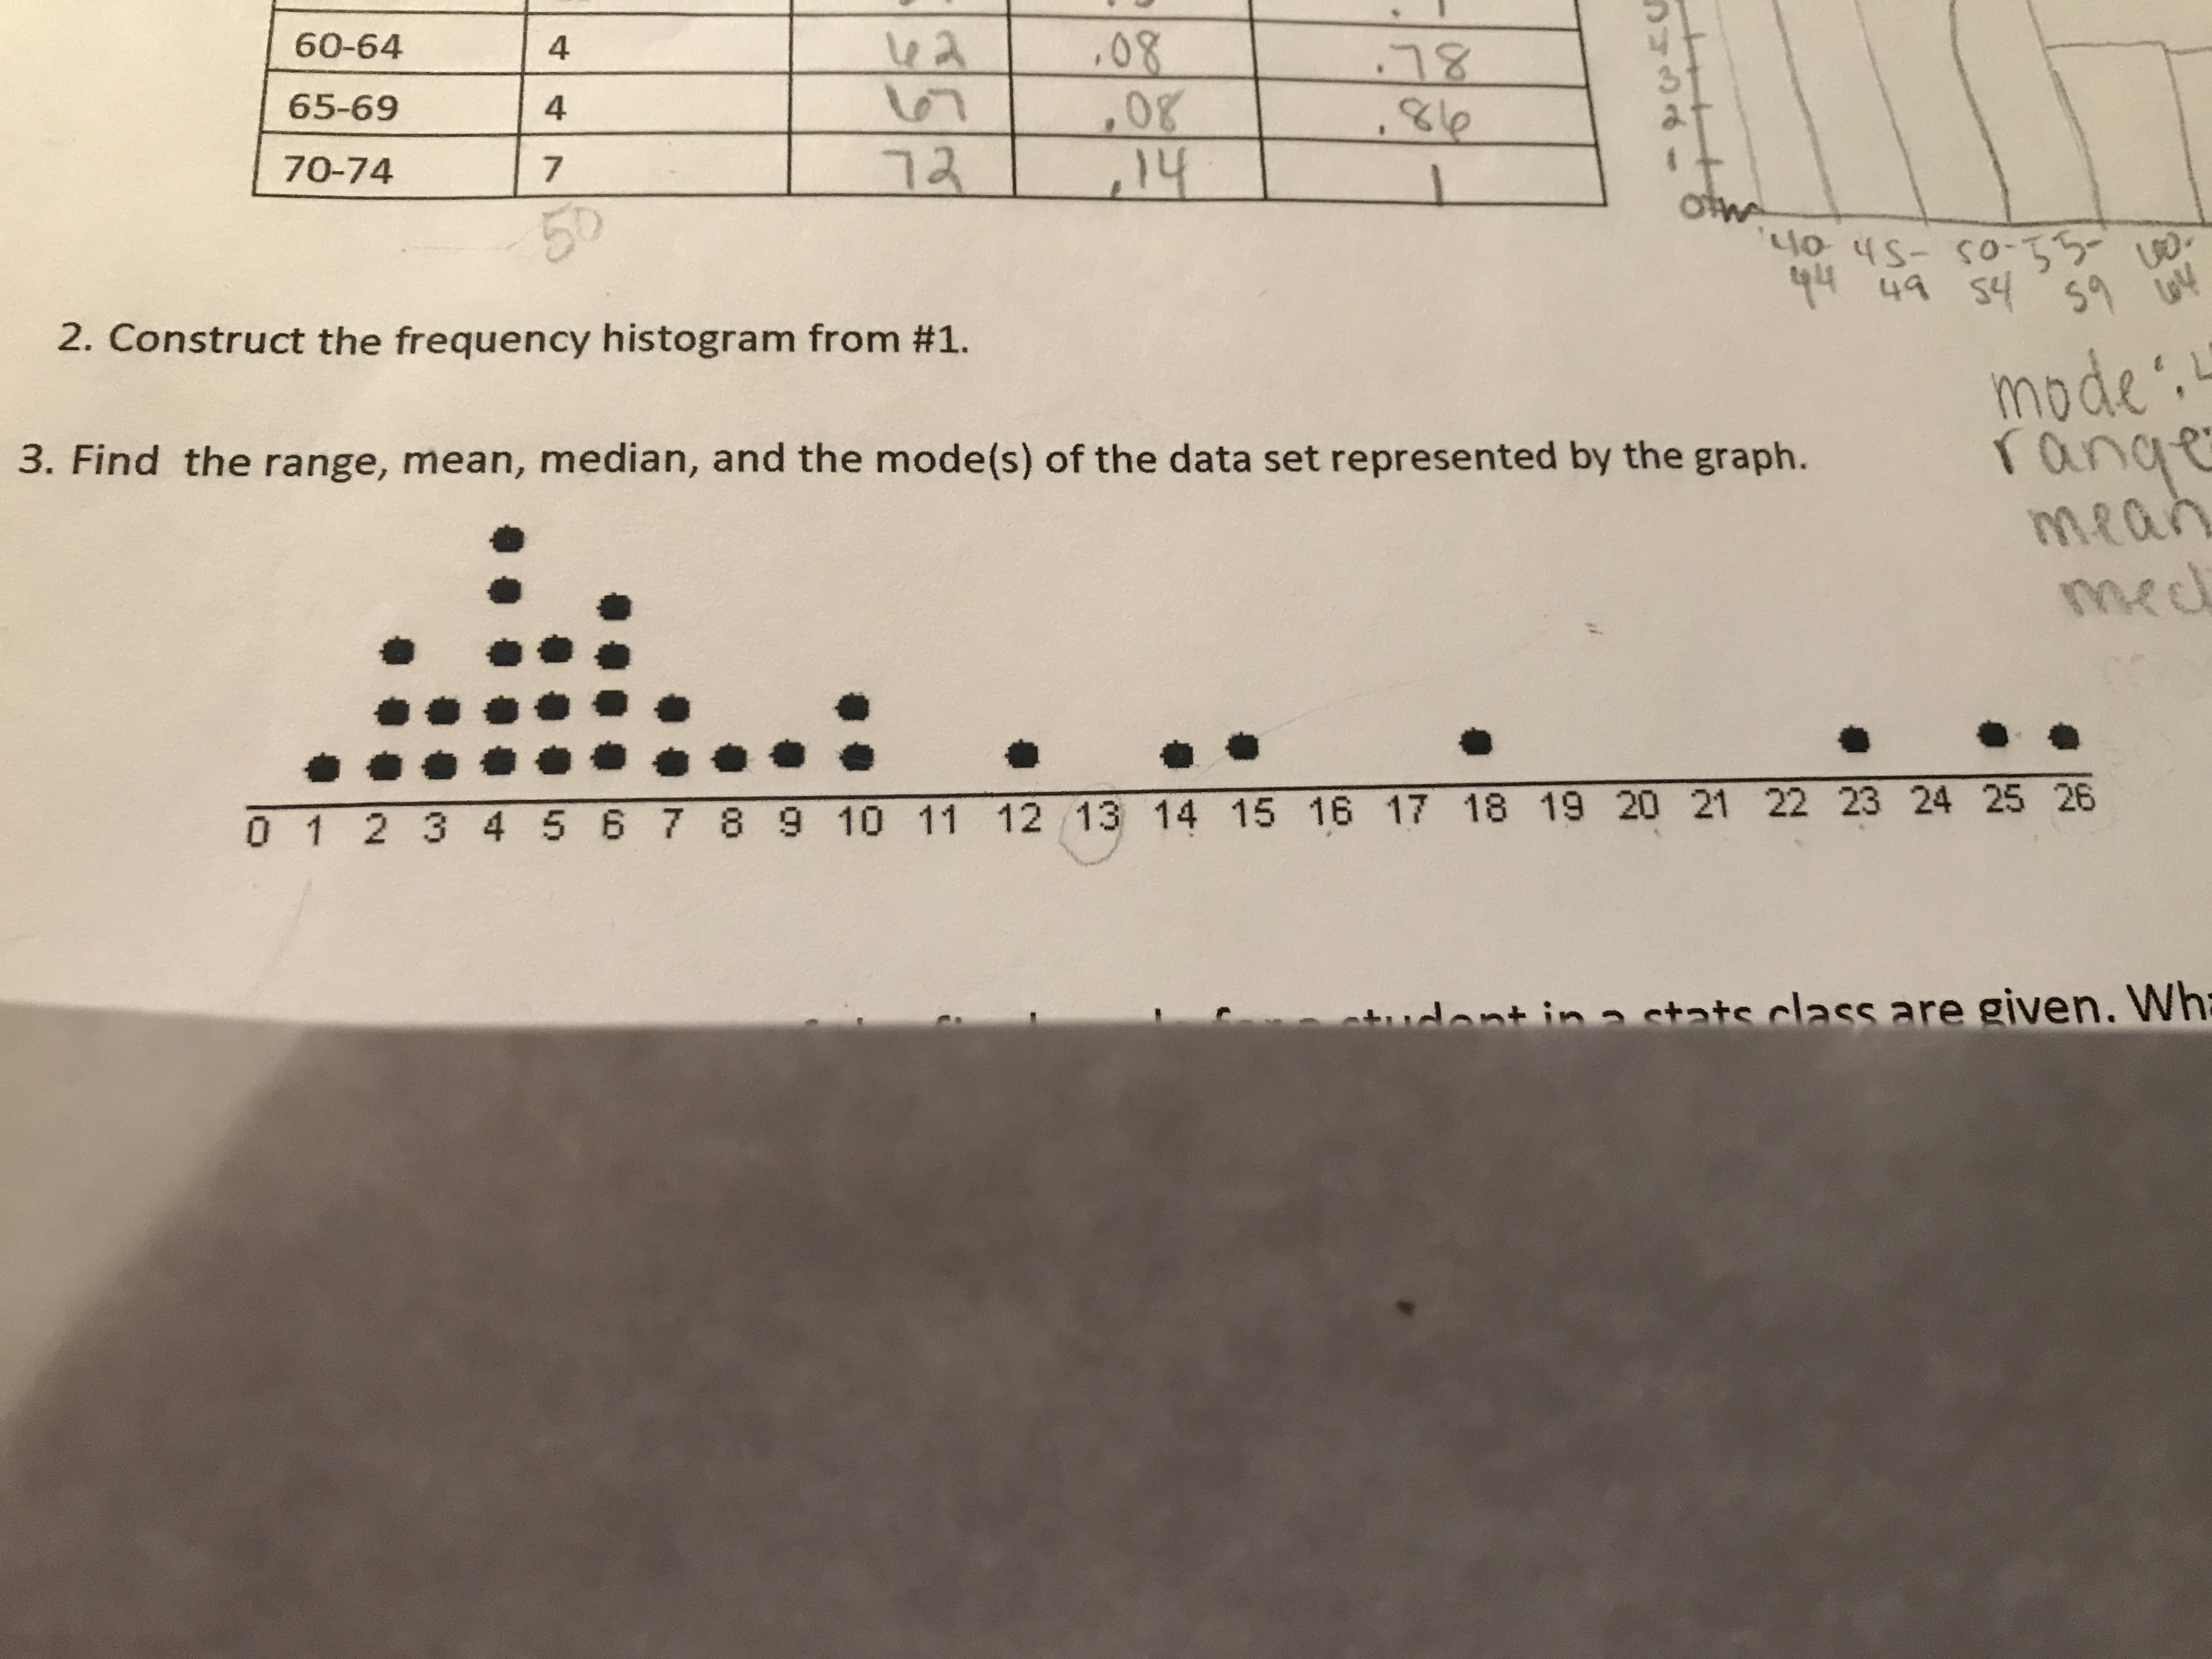
.08 60-64 .78 8e 65-69 4 14 72 70-74 oth 4o 45- so-35- q4 49 54 59 u4 50 2. Construct the frequency histogram from #1. mode"t range mean med 3. Find the range, mean, median, and the mode(s) of the data set represented by the graph. 01 2345 6 7 8 9 10 11 12 13 14 15 16 17 18 19 20 21 22 23 24 25 26 udent in a stats class are given. Wh:


Inverse Normal Distribution
The method used for finding the corresponding z-critical value in a normal distribution using the known probability is said to be an inverse normal distribution. The inverse normal distribution is a continuous probability distribution with a family of two parameters.
Mean, Median, Mode
It is a descriptive summary of a data set. It can be defined by using some of the measures. The central tendencies do not provide information regarding individual data from the dataset. However, they give a summary of the data set. The central tendency or measure of central tendency is a central or typical value for a probability distribution.
Z-Scores
A z-score is a unit of measurement used in statistics to describe the position of a raw score in terms of its distance from the mean, measured with reference to standard deviation from the mean. Z-scores are useful in statistics because they allow comparison between two scores that belong to different normal distributions.
What is the


Trending now
This is a popular solution!

Step by step
Solved in 1 steps with 1 images


