0 1 2 QUANTITY (Used tablets) 3 150 100 50 200 250 0 Alex 1 PRICE (Dollars per used tablet) Becky WA m A Clancy m Eileen Hubert Kate H D Region A (the purple shaded area) represents the total producer surplus when the market price is S represents when the market price In the following table, indicate which statements are true or false based on the information provided on the previous graph. Statement True False O O Assuming each student receives a positive surplus, Becky will always receive less producer surplus than Clancy. Producer surplus is larger when the price is $175 than when it is $150 O O In order for Eileen to earn a producer surplus of exactly $25 from selling a used tablet, the market price needs to be S 300 → while Region B (the grey shaded area)
0 1 2 QUANTITY (Used tablets) 3 150 100 50 200 250 0 Alex 1 PRICE (Dollars per used tablet) Becky WA m A Clancy m Eileen Hubert Kate H D Region A (the purple shaded area) represents the total producer surplus when the market price is S represents when the market price In the following table, indicate which statements are true or false based on the information provided on the previous graph. Statement True False O O Assuming each student receives a positive surplus, Becky will always receive less producer surplus than Clancy. Producer surplus is larger when the price is $175 than when it is $150 O O In order for Eileen to earn a producer surplus of exactly $25 from selling a used tablet, the market price needs to be S 300 → while Region B (the grey shaded area)

Chapter4: Markets In Action
Section: Chapter Questions
Problem 1SQP

Related questions
Question
P2
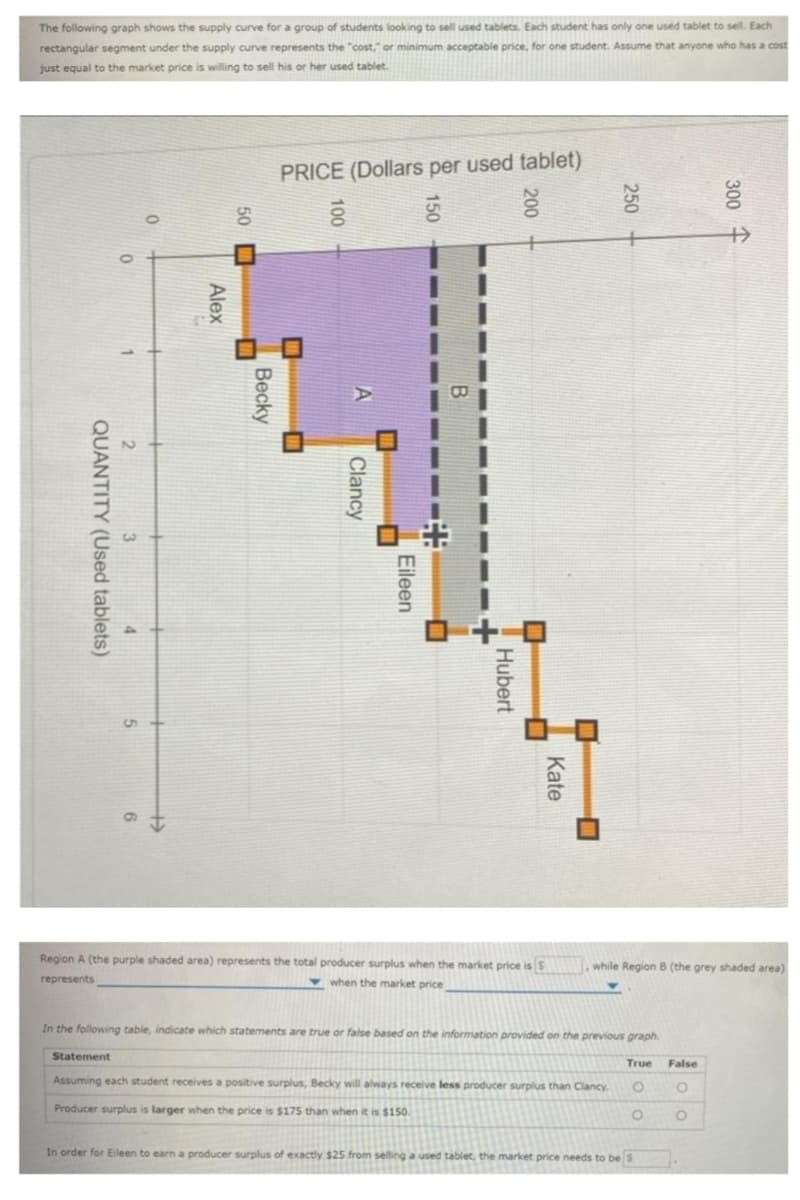
Transcribed Image Text:The following graph shows the supply curve for a group of students looking to sell used tablets. Each student has only one used tablet to sell. Each
rectangular segment under the supply curve represents the "cost," or minimum acceptable price, for one student. Assume that anyone who has a cost
just equal to the market price is willing to sell his or her used tablet.
PRICE (Dollars per used tablet)
150
1
2
QUANTITY (Used tablets)
4
0
50
100
Alex
1
Becky
WA
m
A
B
Clancy
H
Eileen
H
Hubert
200
250
300
H
U
H
5
Region A (the purple shaded area) represents the total producer surplus when the market price is $
when the market price
represents
In the following table, indicate which statements are true or false based on the information provided on the previous graph.
Statement
True False
O
O
Assuming each student receives a positive surplus, Becky will always receive less producer surplus than Clancy.
Producer surplus is larger when the price is $175 than when it is $150.
O
O
In order for Eileen to earn a producer surplus of exactly $25 from selling a used tablet, the market price needs to be S
Kate
■
while Region B (the grey shaded area)
Expert Solution
This question has been solved!
Explore an expertly crafted, step-by-step solution for a thorough understanding of key concepts.

This is a popular solution!

Trending now
This is a popular solution!

Step by step
Solved in 2 steps

Knowledge Booster


Learn more about
Need a deep-dive on the concept behind this application? Look no further. Learn more about this topic, economics and related others by exploring similar questions and additional content below.Recommended textbooks for you


Exploring Economics
Economics
ISBN:
9781544336329
Author:
Robert L. Sexton
Publisher:
SAGE Publications, Inc
