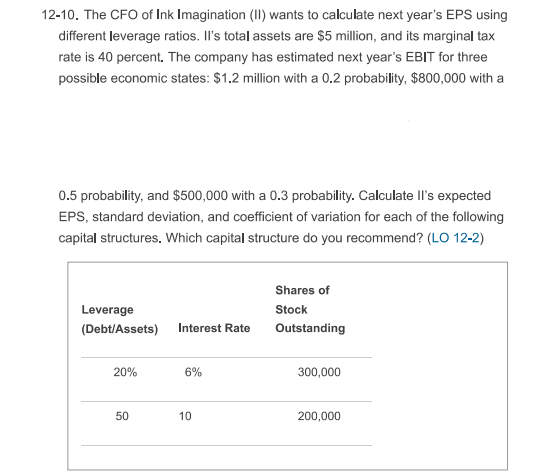
0.5 probability, and $500,000 with a 0.3 probability. Calculate Il's expected EPS, standard deviation, and coefficient of variation for each of the following capital structures. Which capital structure do you recommend? (LO 12-2)


Q: Correlation coefficient? Give handwritten answer with 3 decimal answer
A: Given that, X 6 1 2 3 7 Y 4 5 7 1 3
Q: Calculate the probability for both groups.
A: It is given that The number of family from CA owns a home = 730 The number of family from CA do not…
Q: 3. Consider the following data, taken from the Federal Reserve Bank's Web site. Perform the graphing…
A: The question is about correlation Given : To find : c ) Create scatter plot d ) Interpretation of…
Q: Let S be the universal set, where: S = {1, 2, 3, 18, 19, 20} Let sets A and B be subsets of S,…
A: The universal set S is {1,2,3,4,5,6,7,8,9,10,11,12,13,14,15,16,17,18,19,20}.
Q: For numbers 1 to 4: Tay-Sachs (TS) disease is a rare genetic disorder passed from parents to…
A: A random variable is a variable whose values depend on the outcomes of a random experiment. A random…
Q: Given a variable that has a t distribution with the specified degrees of freedom, what percentage of…
A: Note: According to Bartleby guidelines expert solve only one question and maximum 3 subpart of the…
Q: A chemical supply company currently has in stock 100 lb of a certain chemical, which it sells to…
A: Given that Let X be the number of batches ordered by a randomly chosen customer We have to…
Q: Given the variable X and the frequency of its occurrence below. What is the mean of the…
A: Answer:- Given the variable X and the frequency X Frequency 4 2 8 5 12 10 16 25 20 5…
Q: The given data set is: 10 19 5 5 Find the median. 16 7 19 22
A: It is given that The data is 10, 19, 5, 5, 16, 7, 19, 22
Q: C) A research conducted by SSTA022 Class representative at the University of Limpopo indicates that…
A: In hypothesis testing, there are always two hypotheses. These are null and alternative hypotheses.…
Q: The paper "The Effects of Adolescent Volunteer Activities on the Perception of Local Society and…
A:
Q: 16. Determine the Most Appropriate Measure of Center A. Hair styles of students on a given college…
A: Since you have posted a question with multiple sub-parts, we will solve first three subparts for…
Q: How many students owned a dog and a cat, but not a bird? e)How many students owned a cat or a bird,…
A: It is given that the Vet Tech students at SUNY Canton surveyed 120 students at the college to find…
Q: Here are some fictional scores on a recent exam: 63, 72, 83, 95, 92, 68, 76, 85. The mean was 79.25…
A: 1. The given mean is 79.25 and standard deviation is 10.67.
Q: Let the Universal set be the letters a through j: U = {a, b, ..., i, j}. Let A = (a, b, e, f), B =…
A: Ans#- Let the Universal U = {a, b, c, ..., i, j} A = {a, b, e, f}, B = {e, f, g, i}, and C…
Q: The sum of two positive quantities is equal to 2n. Find the chance that their product is not less…
A:
Q: Find the median of the following data 8,11,7,9,14,16,3,13,17,21,15
A: Answer: Given data is, 8,11,7,9,14,16,3,13,17,21,15 Sample size (n) = 11 Data in ascending order is…
Q: The decline of salmon fisheries along the Columbia River in Oregon has caused great concern among…
A: The independent variable is squawfish length (x).
Q: A research conducted by SSTA022 Class representative at the University of Limpopo indicates that…
A: There are two independent samples which are active and inactive African men. We have to test whether…
Q: Classify each characteristic as a qualitative or quantitative: Time Type of car Town of birth…
A: Solution The variables which can be measured numerically is quantitative otherwise they are…
Q: An experiment was conducted to determine whether giving candy to dining parties resulted in greater…
A: given data independent samples,comed from normal population assume unequal variances, α =…
Q: Let S be the universal set, where: S = {1, 2, 3, 18, 19, 20} .... Let sets A and B be subsets of S,…
A: We have given that Let S be the universal set, where:S= {1, 2, 3, .., 18, 19, 20}And, A and B be…
Q: A researcher wants to determine the concentrations of lead and copper in the soil within a field.…
A: It is given that the statement about to the sampling technique. Here, need to find out the correct…
Q: A researcher claims that at least 10% of all football helmets have manufacturing flaws that could…
A: Here, p=0.1 n=200 Let x=number of helmets contained defects that could cause injury x=16
Q: Here is a data set summarized as a stem-and-leaf plot: 6# | 23444599 7# | 0001123444566789 8# |…
A: The stem-and-leaf plot is given.
Q: 3. Consider the following circuit. The probability that each device functions correctly is P = 0.7…
A: Given that: The probability that the first device functions properly, p1=0.70 The probability that…
Q: If the probability of a new employee in a fast-food chain still being with the company at the end of…
A:
Q: 1. What is the correlation coefficient for the two variables listed below? It is probably easiest to…
A: Data given X:19,4,12,54,51,53,64,82,85,86 Y:1,14,65,54,96,98,91,88,96,66
Q: Would you expect distributions of these variables to be uniform, unimodal, or bimodal? Symmetric or…
A: From given data : (a) The number of songs that each student in your class has downloaded online(b)…
Q: The conditional probability that the event A occurs, given that the event B occurs, is given by…
A:
Q: Find the value of the test statistic. (Round your answer to two decimal places.) Find the p-value.…
A: To solve this problem we use excel,
Q: Find the standard deviation of the data summarized in the given frequency distribution. The test…
A: The number of classes is 5 and the total number of students is 8+6+10+5+11=40.
Q: DATA: 6, 6, 8, 8, 8, 10, 13, 13, 13, 15, 20, 20, 25 WHICH IS THE MOST FREQUENT BUT LARGEST PIECE OF…
A: DATA : 6,6,8,8,8,10,13,13,13,15,20,25
Q: g. to left of Z is 33% h. to the leftt of Z is 0.43% i. top 15% j. lowest 5%
A: As per our company guidelines we are supposed to answer only first 3 sub-parts. Kindly repost other…
Q: This is incorrect
A: I am solving first 3 subpart correctly We have given that Mean(µ) = 67Standard deviations (σ) =…
Q: which section, verbal or quantitative, was the student's performance better? Round your answers to…
A: It is given that For verbal GRE score: M = 152 s = 7 For quantitative score: M = 149 s = 7
Q: sales manager would like to see his sales representative’s unit sales per month. The secretary was…
A: The data is as below 5, 6, 8, 10, 10, 14, 15, 16, 16, 17, 17, 18, 19, 21, 21, 23, 26, 27, 28, 28,…
Q: In how many ways can a caravan of 8 tricycles from Pulo be arrabged in a circle?
A: It is given that a caravan of 8 tricycles from Pulo.
Q: 1. Present pie charts that show the market share within each geographic region. Size the pie charts…
A: a) Construct the pie chart for each of the country separately. Using Excel, following are the steps…
Q: C.28. A car dealership records the number of cars sold each month and finds the mean =56 and the…
A: Given that A car dealership records the number of cars sold each month and finds the mean =56 and…
Q: A particular telephone number is used to receive both voice calls and fax messages. Suppose that 20%…
A: given data P(incoming call involve fax message) = p = 0.20n = 20 incoming callsx = number of…
Q: Using integrals, directly calculate the variance of the Weibull distribution with shape α and scale…
A:
Q: RMSE ME MAD MPE MAPE % %
A: here we have to find RMSE,ME,MAD,MPE,MAPE we use excel to find RMSE,ME,MAD,MPE,MAPE
Q: The Venn diagram here shows the cardinality of each set. Use this to find the cardinality of e-…
A: Answer:- Given Venn diagram here shows the cardinality of each set A = { 14, 5, 3, 4…
Q: The percent of the total variance that can be explained by the regression equation is:
A: It is given that r = 0.99821r2 = 0.99780
Q: Given the following frequency distribution for a sample, the standard deviation for the distribution…
A:
Q: 1. States that experience four seasons tend to have more issues with potholes because of the changes…
A:
Q: 1 b) A research conducted by SSTA022 Class representative at the University of Limpopo indicates…
A:
Q: A local community college reported that the average SAT score of its students is 960 with a standard…
A: Suppose random variable x defines the SAT score of a student.
Q: This study looked at the effectiveness of nicotine chewing gum versus a placebo on smoking cessation…
A: From the given study, the study looking the effectiveness of nicotine chewing gum versus a placebo…

Step by step
Solved in 4 steps

- Starting in 2010, on the heels of the 2007-2009 subprime mortgage crisis, the United States saw an epidemic of mortgage foreclosures, often initiated improperly by large financial institutions. This question is based on the following table, which shows the numbers of foreclosures in three states during three months of 2011. June July August California 54,100 56,200 59,400 Florida 23,800 22,400 23,600 Texas 9,300 10,600 10,100 Your law firm handled 30% of all forclosures in each state in june, 10% of all foreclosures in July, and 40% of all foreclosures in August 2011. Use matrix multiplication to compute the total number of foreclosures handled by your firm in each of the states shown. Total California Florida Texas1. Expenses for Joey's college attendance next year are as follows (in $): Tuition = 8400 Dormitory = 5400 Meals ~Unif(900,1350) Entertainment ~Unif(600,1200) Transportation ~Unif(200,600) Books ~Unif(400,800) Here are the income streams the student has for next year: Scholarship = 3000 Parents = 4000 Waiting Tables ~Unif(3000,5000) Library Job ~Unif(2000,3000) Use Monte Carlo simulation to estimate the expected value of the loan that will be needed to enable Joey to go to college next year.Nicholas Grammas is an investment analyst examining the performance of two mutual funds with Janus Capital Group: the Janus Balanced Fund and the Janus Overseas Fund. The Janus Balanced Fund (JANBX): This “core” fund consists of stocks and bonds and its goal is diversification. It has historically produced solid long-term returns through different market cycles. The Janus Overseas Fund (JAOSX): This fund invests in overseas companies based on their individual merits instead of their geography or industry sector. The following table reports a portion of the annual returns (in percent) for these two funds from 2000–2016. Year. Balanced. Overseas 2000 -2.16 -18.57 2001 -5.04 -23.11 2002 -6.56 -23.89 2003 13.74 36.79 2004 8.71 18.58 2005 7.75 32.39 2006 10.56 47.21 2007 10.15 27.76 2008 -15.22 -52.75 2009 24.28 78.12 2010 7.83 19.28…
- XYZ Manufaturing company has hired a new VP (D.A.King) for managing capacity investment decisions. Mr. King reviews the situation after he comes on board and decides that he can invest in Batch manufacturing, Custom manufacturing or Group technology. Mr. King will not be able to forecast demand accurately till after the technology choices are made. Demand will be classified into four scenarios: poor, fair, good and excellent. The table below indicates the payoffs for each combination of technology choice and demand scenario. POOR FAIR GOOD EXCELLENT PROBABILITY 0.1 0.4 0.3 0.2 Batch - $200,000 $1,000,000 $1,200,000 $1,300,000 Custom $100,000 $300,000 $700,000 $800,000 Group Technology - $1,000,000 -$500,000 $500,000 $2,000,000 1.What is the expected monetary value of choosing the Group Technology option? 2.What is the expected monetary value of choosing the Batchoption? 3What is the BEST decision based on…General Buck Turgidson is preparing to make his annual budget presentation to the U.S. Senate and is speculating about his chances of getting all or part of his requested budget approved. From his 20 years of experience in making these requests, he has deduced that his chances of getting between 50 and 74 percent of his budget approved are twice as good as those of getting between 75 and 99 percent approved, and two and one-half times as good as those of getting between 25 and 49 percent approved. Further, the general believes that there is no chance of less than 25 percent of his budget being approved. Finally, the entire budget has been approved only once during the general’s tenure, and the general does not expect this pattern to change. What are the probabilities of 0–24 percent, 25–49 percent, 50–74 percent, 75–99 percent, and 100 percent approval, according to the general?1. A number of fast-food chains, after their success with offering their customers fresh salads, and in an effort to downplay the image of selling unhealthy food, began adding fresh fruit plates to their menus. At about the same time, and seemingly in direct conflict with this "healthy" strategy, several other fast-food chains began offering fat- and calorie-laden items to their menus. Compare these two widely different approaches, and predict the chances of each one's success. Name some other products that are popular, despite known health risks. 2. In wintry conditions, highway safety is improved by treating road surfaces with substances that will provide traction and/or melt snow and ice. Sand and rock salt are two widely used substances. Recently, a combination of beet juice and rock salt is being used in some parts of the country to treat road surfaces. Suppose you have been asked to provide a list of factors to consider for a switch from rock salt alone to using a combination of…
- The marketing department of a soft drink company wishes to determine the best investment level (Low, High) for introducing a new crystal-clear drink. The payoffs depending on market share for the two decision alternatives is given below: Market Share Investment Level < 1% 1% - 4% > 4% Low 300,000 400,000 500,000 High -400,000 300,000 3,000,000 The probability for a market share less than 1% is 0.3 and the probability for a market share more than 4% is 0.2. a) To minimize the maximum regret, which investment level should the department choose? b) To maximize expected values, which investment level should the department choose? c) What is the maximum amount the department should spend to get more information about the possible market share?Consider the following payoff table. States of Nature Alternatives A B Alternative 1 100 150 Alternative 2 200 100 Probability 0.4 0.6 How much should be paid for a perfect forecast of the state of nature? 100 30 170 10A store manager observes that the morale of employees in her supermarket is low. She thinks that if their working conditions are improved, pay scales rose, and the vacation benefits made more attractive, the morale will be boosted. She doubts, however, if an increase in pay scales would raise the morale of all employees. Her conjecture is that those who have supplemental incomes will just not be “turned on” by higher pay, and only those without side incomes will be happy with increased pay, with a resultant boost in morale Based on the scenario presented, answer the following questions: A) Identify the Independent, Dependent, Moderating, and Mediating Variables. Also provide justification for your choice. B) Create a schematic diagram (i.e., conceptual framework) that depicts the relationships among the variables. C) Based on the above conceptual framework develops at least four alternate hypotheses.
- Select one: a. time-series b. cross sectional c. panel Business School Full-Time Enrollment Students per Faculty Local Tuition ($) Foreign Tuitiion ($) English Test Work Experience Starting Salary ($) 1 Melbourne Business School 200 5 24,420 29,600 No Yes 71,400 2 University of New South Wales (Sydney) 228 4 19,993 32,582 No Yes 65,200 3 Indian Institute of Management (Ahmedabad) 392 5 4,300 4,300 No No 7,100 4 Chinese University of Hong Kong 90 5 11,140 11,140 No No 31,000 5 International University of Japan (Niigata) 126 4 33,060 33,060 Yes No 87,000 6 Asian Institute of Management (Manila) 389 5 7,562 9,000 No Yes 22,800 7 Indian Institute of Management (Bangalore) 380 5 3,935 16,000 No No 7,500 8 National University of Singapore 147 6 6,146 7,170 Yes Yes 43,300 9 Indian Institute of Management (Calcutta) 463 8 2,880 16,000 No No 7,400 10 Australian National University (Canberra) 42 2 20,300 20,300 Yes Yes 46,600 11 Nanyang Technological…How common are financial cost or contractual constraints associated with smartphone ownership? A survey of smartphone users found that 48% of the 18- to29-year-olds, 39% of the 30- to 49-year-olds, 24% of the 50- to 64-year-olds, and 19% of those aged 65 or older have reached the maximum amount of data they are allowed to use as part of their plan, at least on occasion: Suppose the survey was based on 300 smartphone owners in each of the four age groups: 18 to 29, 30 to 49, 50 to 64, and 65 and older. Complete parts (a) through (c). a. At the 0.05 level of significance, is there evidence of a difference among the age groups in the proportion of smartphone owners who have reached the maximum amount of data they are allowed to use as part of their plan, at least on occasion? The test statistic is χ2STAT= (Round to three decimal places as needed.) I am struggling in finding the expected frequency can you show in detail how you accomplish this for each…How common are financial cost or contractual constraints associated with smartphone ownership? A survey of smartphone owners found that 48% of the 18- to 29-year-olds, 38% of the 30- to 49-year-olds, 25% of the 50- to 64-year-olds, and 19% of those age 65 or older have reached the maximum amount of data they are allowed to use as part of their plan, at least on occasion. Suppose the survey was based on 200 smartphone owners in each of the four age groups: 18 to 29, 30 to 49, 50 to 64, and 65+. a. At the 0.05 level of significance, is there evidence of a differ-ence among the age groups in the proportion of smartphone owners who have reached the maximum amount of data they are allowed to use as part of their plan, at least on occasion? b. Determine the p-value in (a) and interpret its meaning. c. If appropriate, use the Marascuilo procedure and a=0.05 to determine which age groups differ.


