0.706 1.397 1.860 2.306 2.896 3.355 0.703 1.383 1.833 2.262 2.821 3.250 10 0.700 1.372 1.812 2.228 2.764 3.169 11 0.697 1.363 1.796 2.201 2.718 3.106 12 0.695 1.356 1.782 2.179 2.681 3.055 13 0.694 1.350 1.771 2.160 2.650 3.012 14 0.692 1.345 1.761 2.145 2.624 2.977 15 0.691 1.341 1.753 2.131 2.602 2.947 16 0.690 1.337 1.746 2.120 2.583 2.921 17 0.689 1.333 1.740 2.110 2.567 2.898 18 0.688 1.330 1.734 2.101 2.552 2.878 19 0.688 1.328 1.729 2.093 2.539 2.861 20 0.687 1.325 1.725 2.086 2.528 2.845 21 0.686 1.323 1.721 2.080 2.518 2.831 22 0.686 1.321 1.717 2.074 2.508 2.819 23 0.685 1.319 1.714 2.069 2.500 2.807 24 0.685 1.318 1.711 2.064 2.492 2.797 25 0.684 1.316 1.708 2.060 2.485 2.787 26 0.684 1.315 1.706 2.056 2.479 2.779 27 0.684 1.314 1.703 2.052 2.473 2.771 28 0.683 1.313 1.701 2.048 2.467 2.763 29 0.683 1.311 1.699 2.045 2.462 2.756 30 0.683 1.310 1.697 2.042 2.457 2.750 40 0.681 1.303 1.684 2.021 2.423 2.704 60 0.679 1.296 1.671 2.000 2.390 2.660 120 0.677 1.289 1.658 1.980 2.358 2.617 0.674 1.282 1.645 1.960 2.326 2.576 The critical t scores (the values that define the borders of the critical region) are The estimated standard error is The t statistic is The t statistic in the critical region. Therefore, the null hypothesis rejected. Therefore, the researcher v condude that SAM-e has a significant effect on the moods of Aluheimer's patients.
0.706 1.397 1.860 2.306 2.896 3.355 0.703 1.383 1.833 2.262 2.821 3.250 10 0.700 1.372 1.812 2.228 2.764 3.169 11 0.697 1.363 1.796 2.201 2.718 3.106 12 0.695 1.356 1.782 2.179 2.681 3.055 13 0.694 1.350 1.771 2.160 2.650 3.012 14 0.692 1.345 1.761 2.145 2.624 2.977 15 0.691 1.341 1.753 2.131 2.602 2.947 16 0.690 1.337 1.746 2.120 2.583 2.921 17 0.689 1.333 1.740 2.110 2.567 2.898 18 0.688 1.330 1.734 2.101 2.552 2.878 19 0.688 1.328 1.729 2.093 2.539 2.861 20 0.687 1.325 1.725 2.086 2.528 2.845 21 0.686 1.323 1.721 2.080 2.518 2.831 22 0.686 1.321 1.717 2.074 2.508 2.819 23 0.685 1.319 1.714 2.069 2.500 2.807 24 0.685 1.318 1.711 2.064 2.492 2.797 25 0.684 1.316 1.708 2.060 2.485 2.787 26 0.684 1.315 1.706 2.056 2.479 2.779 27 0.684 1.314 1.703 2.052 2.473 2.771 28 0.683 1.313 1.701 2.048 2.467 2.763 29 0.683 1.311 1.699 2.045 2.462 2.756 30 0.683 1.310 1.697 2.042 2.457 2.750 40 0.681 1.303 1.684 2.021 2.423 2.704 60 0.679 1.296 1.671 2.000 2.390 2.660 120 0.677 1.289 1.658 1.980 2.358 2.617 0.674 1.282 1.645 1.960 2.326 2.576 The critical t scores (the values that define the borders of the critical region) are The estimated standard error is The t statistic is The t statistic in the critical region. Therefore, the null hypothesis rejected. Therefore, the researcher v condude that SAM-e has a significant effect on the moods of Aluheimer's patients.

Holt Mcdougal Larson Pre-algebra: Student Edition 2012
1st Edition
ISBN:9780547587776
Author:HOLT MCDOUGAL
Publisher:HOLT MCDOUGAL
Chapter11: Data Analysis And Probability
Section: Chapter Questions
Problem 8CR

Related questions
Question
answer multiple-choice and fill all the blanks.
Transcribed Image Text:0.706
1.397
1.860
2.306
2.896
3.355
0.703
2.262
2.821
1.383
1.833
3.250
10
0.700
1.372 1.812
2.228
2.764
3.169
11
0.697
1.363
1.796
2.201
2.718
3.106
12
0.695
1.356
1.782
2.179
2.681
3.055
13
0.694
1.350
1.771
2.160
2.650
3.012
14
0.692
1.345
1.761
2.145
2.624
2.977
15
0.691
1.341
1.753
2.131
2.602
2.947
16
0.690
1.337
1.746
2.120
2.583
2.921
17
0.689
1.333
1.740
2.110
2.567
2.898
18
0.688
1.330
1.734
2.101
2.552
2.878
19
0.688
1.328
1.729
2.093
2.539
2.861
20
0.687
1.325
1.725
2.086
2.528
2.845
21
0.686
1.323
1.721
2.080
2.518
2.831
22
0.686
1.321
1.717
2.074
2.508
2.819
23
0.685
1.319
1.714
2.069
2.500
2.807
0.685
2.064
24
1.318
1.711
2.492
2.797
25
0.684
1.316
1.708
2.060
2.485
2.787
26
0.684
1.315
1.706
2.056
2.479
2.779
27
0.684
1.314
1.703
2.052
2.473
2.771
28
0.683
1.313
1.701
2.048
2.467
2.763
29
0.683
1.311
1.699
2.045
2.462
2.756
30
0.683
1.310
1.697
2.042
2.457
2.750
40 0.681
1.303
1.684
2.021
2.423
2.704
60 0.679
1.296 1.671
2.000
2.390
2.660
120
0.677
1.289
1.658
1.980
2.358
2.617
0.674
1.282
1.645
1.960
2.326
2.576
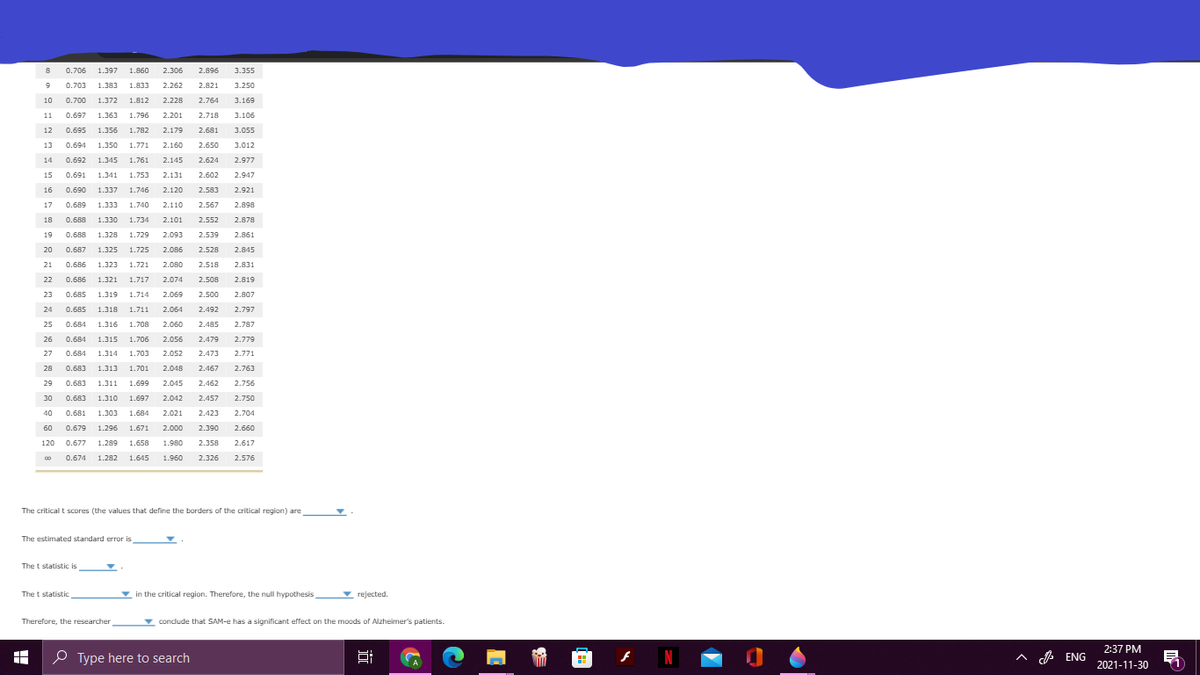
The critical t scores (the values that define the borders of the critical region) are
The estimated standard error is
The t statistic is
The t statistic
▼ in the critical region. Therefore, the null hypothesis rejected.
Therefore, the researcher
condude that SAM-e has a significant effect on the moods of Alzheimer's patients.
2:37 PM
O Type here to search
A A ENG
民
2021-11-30
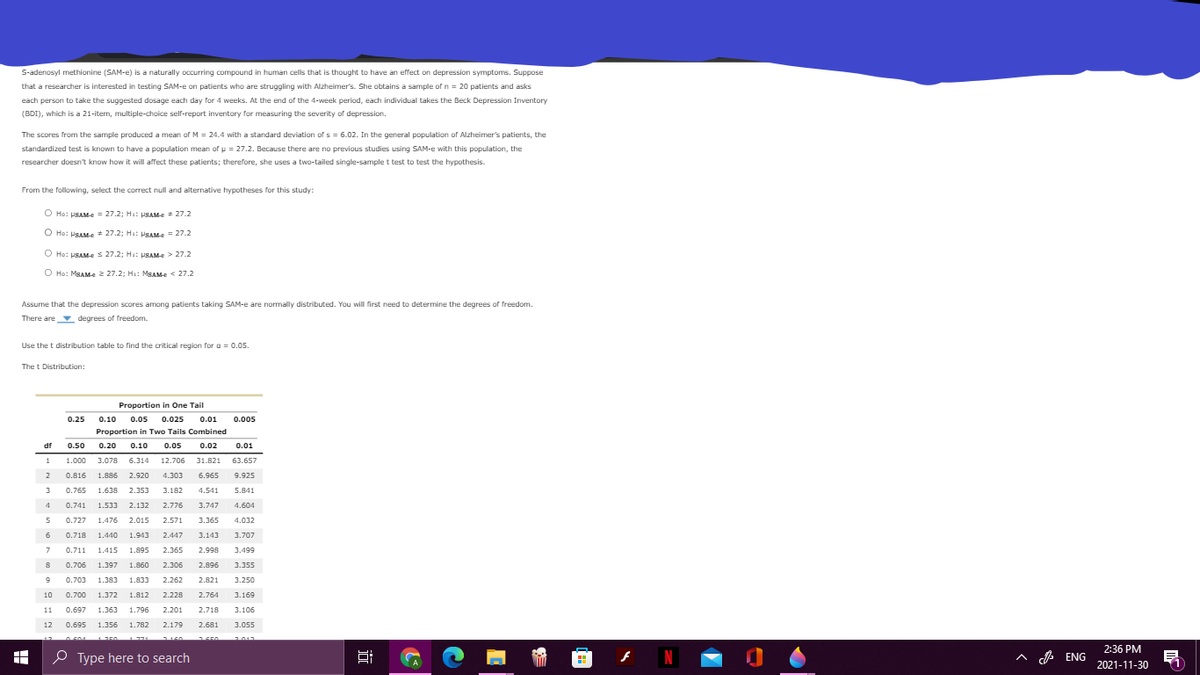
Transcribed Image Text:S-adenosyl methionine (SAM-e) is a naturally occurring compound in human cells that is thought to have an effect on depression symptoms. Suppose
that a researcher is interested in testing SAM-e on patients who are struggling with Alzheimer's. She obtains a sample of n = 20 patients and asks
each person to take the suggested dosage each day for 4 weeks. At the end of the 4-week period, each individual takes the Beck Depression Inventory
(BDI), which is a 21-item, multiple-choice self-report inventory for measuring the severity of depression.
The scores from the sample produced a mean of M = 24.4 with a standard deviation of s = 6.02. In the general population of Alzheimer's patients, the
standardized test is known to have a population mean of u = 27.2. Because there are no previous studies using SAM-e with this population, the
researcher doesn't know how it will affect these patients; therefore, she uses a two-tailed single-sample t test to test the hypothesis.
From the following, select the correct null and alternative hypotheses for this study:
O Ho: PSAM-e = 27.2; Ha: PSAMe = 27.2
O Ho: PSAM-e 27.2; Ha: PSAM-e = 27.2
O Ho: HSAM-e s 27.2; Ha: PSAM-e > 27.2
O Ho: MgAMe 2 27.2: Ha: MBAM-e < 27.2
Assume that the depression scores among patients taking SAM-e are normally distributed. You will first need to determine the degrees of freedom.
There are degrees of freedom.
Use the t distribution table to find the critical region for a = 0.05.
The t Distribution:
Proportion in One Tail
0.25
0.10
0.05
0.025
0.01
0.005
Proportion in Two Tails Combined
df
0.50
0.20 0.10
0.05
0.02
0.01
1
1.000
3.078 6.314
12.706
31.821
63.657
2
0.816
1.886
2.920
4.303
6.965
9.925
3
0.765
1.638
2.353
3.182
4.541
5.841
4
0.741
1.533
2.132
2.776
3.747
4.604
0.727
1.476
2.015
2.571
3.365
4.032
6
0.718
1.440
1.943
2.447
3.143
3.707
7.
0.711
1.415
1.895
2.365
2.998
3.499
0.706
1.397
1.860
2.306
2.896
3.355
0.703
1.383
1.833
2.262
2.821
3.250
10
0.700
1.372
1.812
2.228
2.764
3.169
11
0.697
1.363
1.796
2.201
2.718
3.106
12
0.695
1.356
1.782
2.179
2.681
3.055
0604
2011
2:36 PM
O Type here to search
A A ENG
2021-11-30
近
出
Expert Solution
This question has been solved!
Explore an expertly crafted, step-by-step solution for a thorough understanding of key concepts.

This is a popular solution!

Trending now
This is a popular solution!

Step by step
Solved in 2 steps

Recommended textbooks for you
Holt Mcdougal Larson Pre-algebra: Student Edition…
Algebra
ISBN:
9780547587776
Author:
HOLT MCDOUGAL
Publisher:
HOLT MCDOUGAL

Glencoe Algebra 1, Student Edition, 9780079039897…
Algebra
ISBN:
9780079039897
Author:
Carter
Publisher:
McGraw Hill
Holt Mcdougal Larson Pre-algebra: Student Edition…
Algebra
ISBN:
9780547587776
Author:
HOLT MCDOUGAL
Publisher:
HOLT MCDOUGAL
Glencoe Algebra 1, Student Edition, 9780079039897…
Algebra
ISBN:
9780079039897
Author:
Carter
Publisher:
McGraw Hill