1906 1907 707 205 70% ea 1914 525 335 19 711 497 $21 $14 705 1917 1918 924 1920 1964 1965 194 200 200 2002 2003 2004 200% 729 2010 2011 2012 1870 712 190 1910 70 705 20 705 766 736 129 2871 1861 1954 70 57.1 1872 705 S19 1963 196 199 $19 1957 555 2011 $44 528 1911 1912 1873 1921 195 72 1874 1864 1922 712 241 711 1911 2914 1915 1916 1917 1918 1910 1920 1921 1922 1923 1924 1925 1926 1927 2928 1929 1910 1981 19 1875 1923 1924 1925 1926 1927 1928 2929 1910 1911 1912 1913 S3.2 190 736 729 710 792 190 714 714 70 18 SLI $2.7 703 712 205 70 1876 54.1 1961 7) 191 1972 1973 2007 200 2009 20101 2011 2012 1877 167 1962 1963 714 ninutes ago) 47 1878 1868 553 $42 $2.3 $32 524 1864 723 718 1964 2974 1870 1871 2872 1873 1874 1875 1876 1877 1878 1879 1880 693 52.7 $12 $37 551 1880 $44 727 1975 1976 1977 1974 1999 72.7 1966 1967 747 711 53.4 52 20131 72 725 723 71.2 70.5 72.5 703 72.3 705 70.5 696 70 705 $24 718 19 1970 1973 54.3 $11 716 336 539 714 714 729 711 703 1934 509 705 705 2972 1973 1887 1915 1936 $26 $35 49.3 54.7 54.1 54.2 14.2 $4.3 $27 1937 1974 1889 184 1090 $27 94 14 1975 719 729 1891 S33 1919 1940 1941 1966 198 1892 $19 1882 70.2 s07 70.3 70.7 193 504 18 19701 71.2 22 3
1906 1907 707 205 70% ea 1914 525 335 19 711 497 $21 $14 705 1917 1918 924 1920 1964 1965 194 200 200 2002 2003 2004 200% 729 2010 2011 2012 1870 712 190 1910 70 705 20 705 766 736 129 2871 1861 1954 70 57.1 1872 705 S19 1963 196 199 $19 1957 555 2011 $44 528 1911 1912 1873 1921 195 72 1874 1864 1922 712 241 711 1911 2914 1915 1916 1917 1918 1910 1920 1921 1922 1923 1924 1925 1926 1927 2928 1929 1910 1981 19 1875 1923 1924 1925 1926 1927 1928 2929 1910 1911 1912 1913 S3.2 190 736 729 710 792 190 714 714 70 18 SLI $2.7 703 712 205 70 1876 54.1 1961 7) 191 1972 1973 2007 200 2009 20101 2011 2012 1877 167 1962 1963 714 ninutes ago) 47 1878 1868 553 $42 $2.3 $32 524 1864 723 718 1964 2974 1870 1871 2872 1873 1874 1875 1876 1877 1878 1879 1880 693 52.7 $12 $37 551 1880 $44 727 1975 1976 1977 1974 1999 72.7 1966 1967 747 711 53.4 52 20131 72 725 723 71.2 70.5 72.5 703 72.3 705 70.5 696 70 705 $24 718 19 1970 1973 54.3 $11 716 336 539 714 714 729 711 703 1934 509 705 705 2972 1973 1887 1915 1936 $26 $35 49.3 54.7 54.1 54.2 14.2 $4.3 $27 1937 1974 1889 184 1090 $27 94 14 1975 719 729 1891 S33 1919 1940 1941 1966 198 1892 $19 1882 70.2 s07 70.3 70.7 193 504 18 19701 71.2 22 3

Algebra & Trigonometry with Analytic Geometry
13th Edition
ISBN:9781133382119
Author:Swokowski
Publisher:Swokowski
Chapter7: Analytic Trigonometry
Section7.3: The Addition And Subtraction Formulas
Problem 76E

Related questions
Question
Here is the data with the questions. I need answer od this 3 question.
Transcribed Image Text:Q Lumen OHM
A mat120_119_final_revivew.pdf
b My Questions | bartleby
M CamScanner 11-21-2021 11.47
+
A mail.google.com/mail/u/0/#inbox/FMfcgzGlIcbFGhhpCjtflhkmcZDSWmQf?projector=1&messagePartId=D0.1
I New folder
e Web Store
My LaGuardia - Stu. O Employee-facing re. Y Electronic library D Laugrdia work time.
O Login - FAFSA on th..
WP WileyPLUS
O Lumen OHM
E Reading list
of 183
1906
1907
70.7
Tear
1916
1917
1918
S11
497
52.1
525
535
$1.1
539
519
53
S1.7
1951
1954
195
1956
1957
711
705
703
1869
514
705
685
71.1
1914
1965
2010
2011
2000
2001
2002
725
736
56.7
1860
1908
71.2
S11
51
51
513
70
705
S64
57.3
555
1871
1872
696
1861
1862
1863
1919
1920
1921
1922
1923
1924
1925
1926
1927
1928
1929
709
196
1967
2012
2013
705
1910
0
$17
$44
528
52
129
143
741
736
29
1 minutes ago)
718
2003
703
70.5
709
71.6
714
70
698
1911
1912
1873
698
1958
72
2004
200s
691
711
703
712
70.5
70
1874
1864
712
709
1909
1911
1865
1866
1861
1868
1875
1876
1960
1961
1962
1963
1964
1965
1966
1967
1970
2006
2007
2008
s
$3.2
54.1
53
553
542
544
S24
53.4
52
54.1
536
S19
S11
52.7
50.2
526
$2.7
512
$3.7
1914
1915
1916
1917
712
1971
1972
1973
714
711
721
718
209
713
72.7
1877
528
1878
535
792
2005
2010
2011
2012
2011
$2.3
1869
71.2
727
711
72
725
723
71.2
70.5
72.5
1974
1975
1976
1977
1978
1979
1918
1919
$32
1870
693
694
1880
727
729
747
52.4
1872
2872
1873
1874
1920
1921
1922
1923
1924
52
1910
696
55.1
54.3
1968
1969
1970
1971
1972
505
524
1911
1932
70
705
703
705
718
535
52
523
526
53.5
54
$35
716
511
51
50 9
49.3
1875
1933
1886
1876
1877
1878
1934
714
539
53.5
54.7
541
542
14.2
$4.3
1925
1926
2981
1982
1915
71.4
I887
729
711
725
718
705
1973
1936
1937
1938
1919
1940
1983
702
1889
1890
1891
1892
1893
1879
1880
1881
1882
1883
1927
1928
1929
1910
1974
1975
1976
1977
527
1984
1985
1086
1987
2988
1919
1990
1991
1912
72.3
694
527
538
S1.9
70.5
705
20.9
725
71.2
70.2
69.3
70.2
70.9
516
528
526
$34
1911
1913
1911
1978
528
513
517
$16
53
52
$24
S06
512
$12
1941
1942
1943
1944
70.7
G1.6
203
711
1979
2980
1981
1982
1983
72.3
714
718
72
72
716
716
1894
532
1885
1886
$6 4
54.4
S31
$4.7
544
544
53.7
1934
195
1936
1896
70.3
1887
685
1945
2946
1947
1948
1897
711
70.9
718
714
S4.2
1937
193
1939
1940
1941
1942
190
1994
1995
1996
1997
1984
1985
694
528
53
$59
526
54
548
1893
1900
1890
1891
196
693
687
1901
1949
72
709
711
69.1
72
732
718
771
73
70.7
72.1
72.7
712
718
72.3
729
1987
1950
1951
54.3
1902
1903
1904
1905
68.9
1988
57.1
545
53
562
1998
1989
1990
1991
1992
1991
696
698
1952
1953
1954
1999
2000
1941
56
512
527
1895
1944
709
1896
69.6
539
1906
2001
2002
1945
70.5
539
207
703
1897
1907
1908
1909
1910
504
525
514
195
1956
1957
1958
71.2
.9
189
1899
1946
1947
1948
534
545
557
$68
2003
2004
70.
70.3
20.3
705
712
70.7
698
547
1994
1900
69.6
S18
1995
51
522
51.7
539
513
$2.5
2005
1949
1950
1996
$4.6
S11
539
$24
1901
1959
1960
1911
1912
1913
1914
1915
2006
2007
2008
2009
1902
1903
1918
1951
69.3
696
696
S5 3
1961
1962
1952
1999
1904
1905
54
Transcribed Image Text:W
Project-3.docx
+ Download
a Share
Edits will not be automatically saved.
Save now
File Edit Format Tools Help
Unsaved changes
F Q Q
Times New ..
в I U
A. A -
Normal
12 -
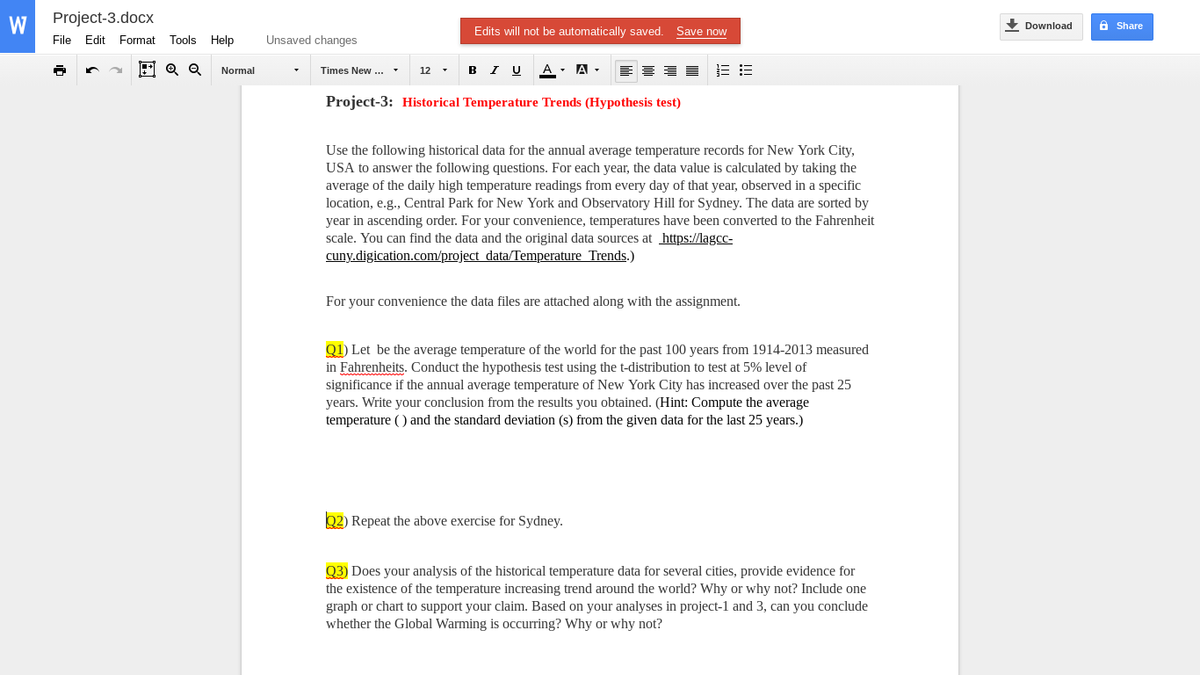
Project-3: Historical Temperature Trends (Hypothesis test)
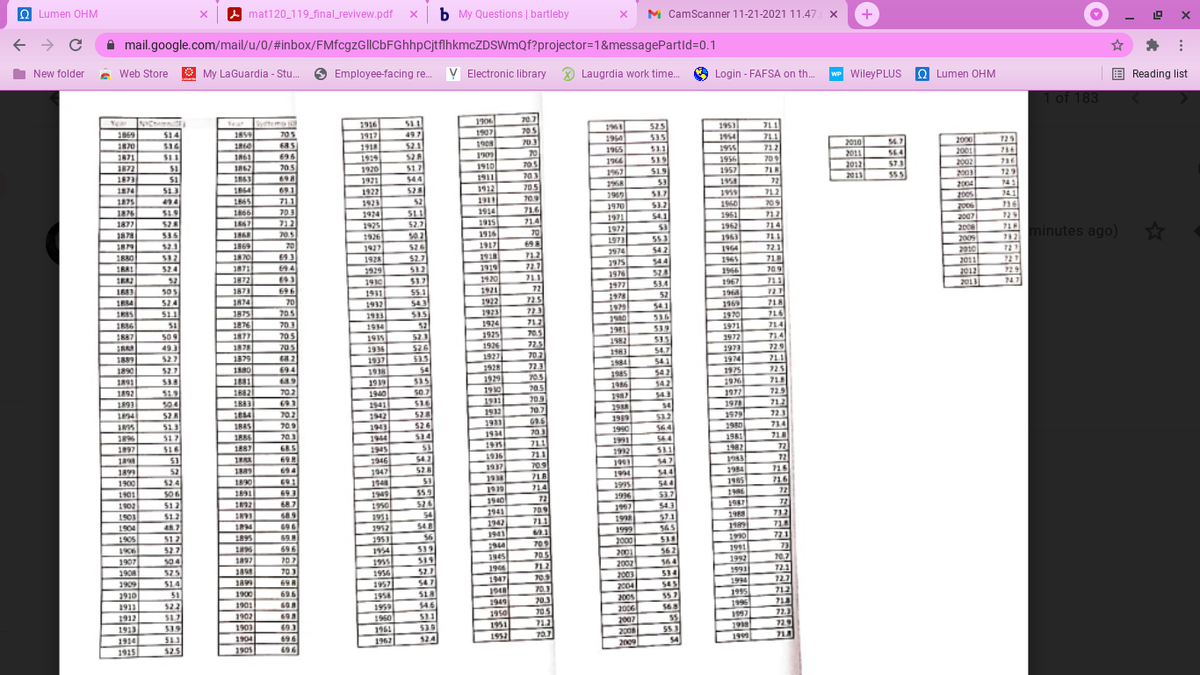
Use the following historical data for the annual average temperature records for New York City,
USA to answer the following questions. For each year, the data value is calculated by taking the
average of the daily high temperature readings from every day of that year, observed in a specific
location, e.g., Central Park for New York and Observatory Hill for Sydney. The data are sorted by
year in ascending order. For your convenience, temperatures have been converted to the Fahrenheit
scale. You can find the data and the original data sources at https://lagcc-
cuny.digication.com/project data/Temperature Trends.)
For your convenience the data files are attached along with the assignment.
Q1) Let be the average temperature of the world for the past 100 years from 1914-2013 measured
in Fahrenheits. Conduct the hypothesis test using the t-distribution to test at 5% level of
significance if the annual average temperature of New York City has increased over the past 25
years. Write your conclusion from the results you obtained. (Hint: Compute the average
temperature () and the standard deviation (s) from the given data for the last 25 years.)
Q2) Repeat the above exercise for Sydney.
Q3) Does your analysis of the historical temperature data for several cities, provide evidence for
the existence of the temperature increasing trend around the world? Why or why not? Include one
graph or chart to support your claim. Based on your analyses in project-1 and 3, can you conclude
whether the Global Warming is occurring? Why or why not?
Expert Solution
This question has been solved!
Explore an expertly crafted, step-by-step solution for a thorough understanding of key concepts.

Step by step
Solved in 7 steps with 3 images

Recommended textbooks for you
Algebra & Trigonometry with Analytic Geometry
Algebra
ISBN:
9781133382119
Author:
Swokowski
Publisher:
Cengage
Algebra & Trigonometry with Analytic Geometry
Algebra
ISBN:
9781133382119
Author:
Swokowski
Publisher:
Cengage