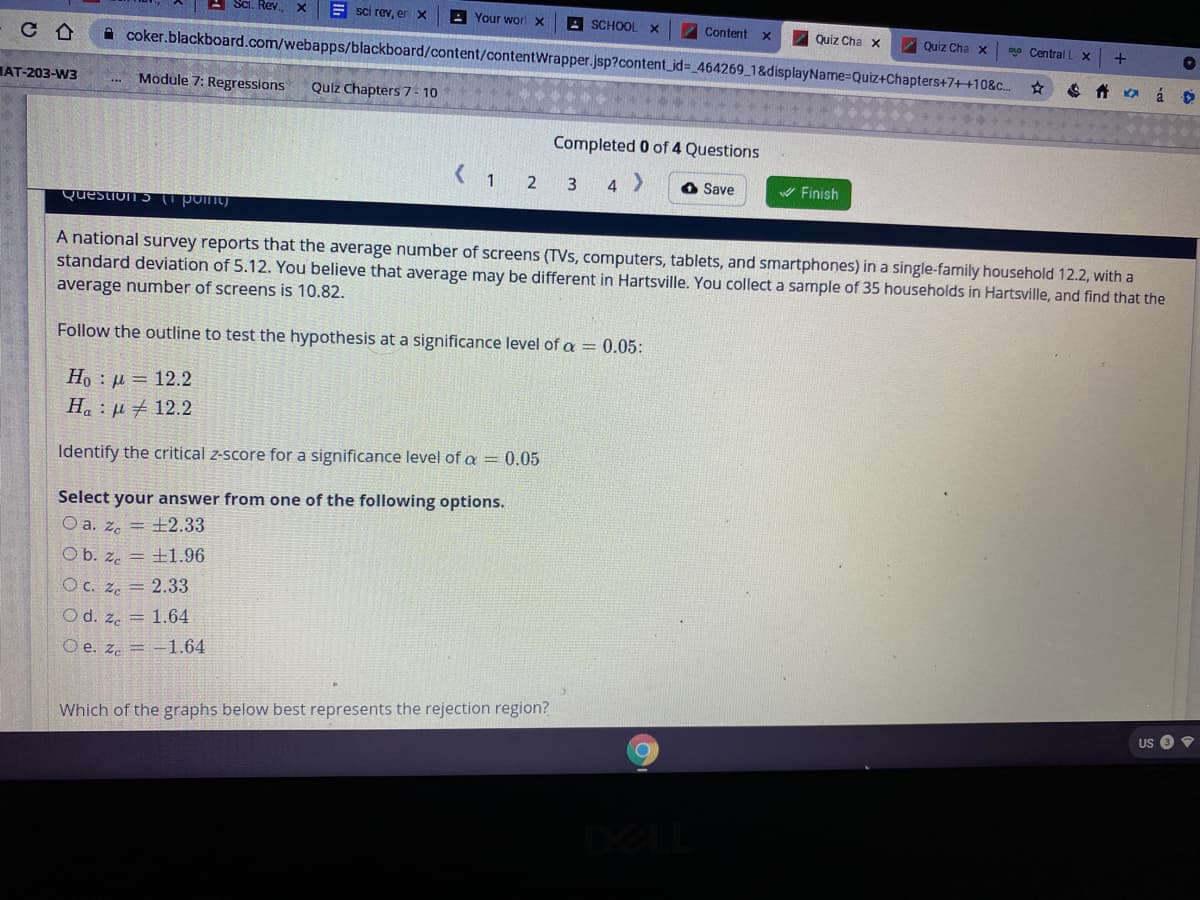
( 1 2 3 4 ) O Save A Finish Question5 (i poinL) A national survey reports that the average number of screens (TVs, computers, tablets, and smartphones) in a single-family household 12.2, with a standard deviation of 5.12. You believe that average may be different in Hartsville. You collect a sample of 35 households in Hartsville, and find that average number of screens is 10.82. Follow the outline to test the hypothesis at a significance level of a = 0.05: Η, : μ 12.2 H.: µ # 12.2 Identify the critical z-score for a significance level of a = 0.05 Select your answer from one of the following options. O a. ze = ±2.33 O b. z. = ±1.96 Oc. ze = 2.33 O d. ze = 1.64 O e. ze = -1.64 Which of the graphs below best represents the rejection region?
( 1 2 3 4 ) O Save A Finish Question5 (i poinL) A national survey reports that the average number of screens (TVs, computers, tablets, and smartphones) in a single-family household 12.2, with a standard deviation of 5.12. You believe that average may be different in Hartsville. You collect a sample of 35 households in Hartsville, and find that average number of screens is 10.82. Follow the outline to test the hypothesis at a significance level of a = 0.05: Η, : μ 12.2 H.: µ # 12.2 Identify the critical z-score for a significance level of a = 0.05 Select your answer from one of the following options. O a. ze = ±2.33 O b. z. = ±1.96 Oc. ze = 2.33 O d. ze = 1.64 O e. ze = -1.64 Which of the graphs below best represents the rejection region?

Algebra & Trigonometry with Analytic Geometry
13th Edition
ISBN:9781133382119
Author:Swokowski
Publisher:Swokowski
Chapter9: Systems Of Equations And Inequalities
Section: Chapter Questions
Problem 54RE

Related questions

Question
Transcribed Image Text:- MacbethX
A Sci. Rev., x
A Sci. Rev., x
E sci rev, er
A Your wor X
SCHOOL X
Content
Z Quiz Cha x
7 Quiz Cha x
oo CentralL X +
A coker.blackboard.com/webapps/blackboard/content/contentWrapper.jsp?content_id- 464269_1&displayName-DQuiz+Chapters+7++10&c.
A KA á
Module 7: Regressions
Quiz Chapters7- 10
MAT-203-W3
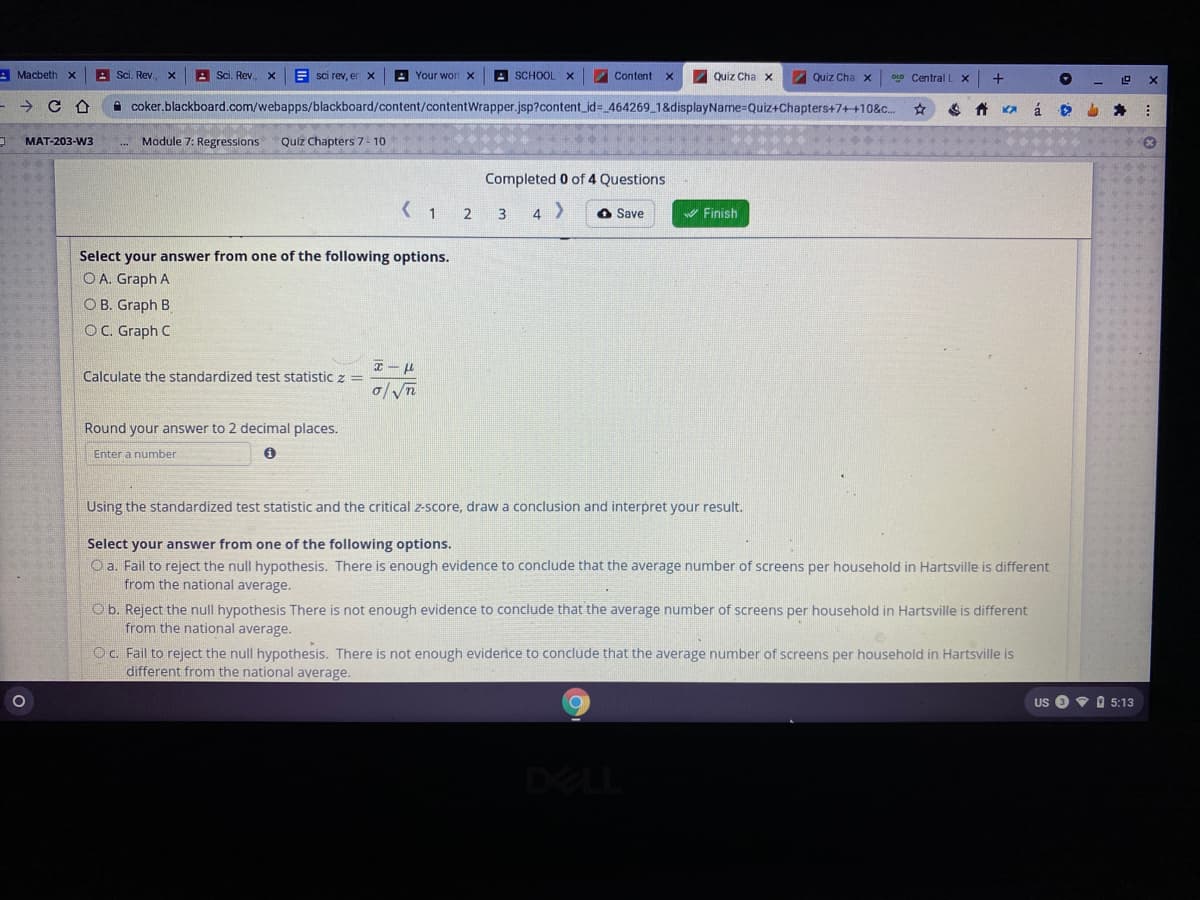
Completed 0 of 4 Questions
( 1 2 3
4 >
O Save
V Finish
Select your answer from one of the following options.
O A. Graph A
OB. Graph B
OC. Graph C
Calculate the standardized test statistic z =
Round your answer to 2 decimal places.
Enter a number
Using the standardized test statistic and the critical z-score, draw a conclusion and interpret your result.
Select your answer from one of the following options.
O a. Fail to reject the null hypothesis. There is enough evidence to conclude that the average number of screens per household in Hartsville is different
from the national average.
Ob. Reject the null hypothesis There is not enough evidence to conclude that the average number of screens per household in Hartsville is different
from the national average.
Oc. Fail to reject the null hypothesis. There is not enough evidenice to conclude that the average number of screens per household in Hartsville is
different from the national average.
US O • O 5:13
DELL
Transcribed Image Text:E sci rev, erx
A Your wori X
A SCHOOL x
Content
Quiz Cha x
Quiz Cha x
A coker.blackboard.com/webapps/blackboard/content/contentWrapper.jsp?content_jd%3 464269 1&displayName%-DQuiz+Chapters+7++10&c.
OLO Central L
+
á
AT-203-W3
Module 7: Regressions
Quiz Chapters 7 - 10
Completed 0 of 4 Questions
2
3
4 >
O Save
A Finish
Question15
(T poimt)
A national survey reports that the average number of screens (TVs, computers, tablets, and smartphones) in a single-family household 12.2, with a
standard deviation of 5.12. You believe that average may be different in Hartsville. You collect a sample of 35 households in Hartsville, and find that the
average number of screens is 10.82.
Follow the outline to test the hypothesis at a significance level of a = 0.05:
Ho : µ = 12.2
H. : µ # 12.2
Identify the critical z-score for a significance level of a = 0.05
Select your answer from one of the following options.
O a. z. = ±2.33
O b. z. = ±1.96
O C. z. = 2.33
O d. z. = 1.64
O e. z. = -1.64
Which of the graphs below best represents the rejection region?
US
Expert Solution
This question has been solved!
Explore an expertly crafted, step-by-step solution for a thorough understanding of key concepts.

Step by step
Solved in 2 steps with 2 images

Knowledge Booster


Learn more about
Need a deep-dive on the concept behind this application? Look no further. Learn more about this topic, statistics and related others by exploring similar questions and additional content below.Recommended textbooks for you
Algebra & Trigonometry with Analytic Geometry
Algebra
ISBN:
9781133382119
Author:
Swokowski
Publisher:
Cengage

Algebra: Structure And Method, Book 1
Algebra
ISBN:
9780395977224
Author:
Richard G. Brown, Mary P. Dolciani, Robert H. Sorgenfrey, William L. Cole
Publisher:
McDougal Littell
Algebra & Trigonometry with Analytic Geometry
Algebra
ISBN:
9781133382119
Author:
Swokowski
Publisher:
Cengage
Algebra: Structure And Method, Book 1
Algebra
ISBN:
9780395977224
Author:
Richard G. Brown, Mary P. Dolciani, Robert H. Sorgenfrey, William L. Cole
Publisher:
McDougal Littell