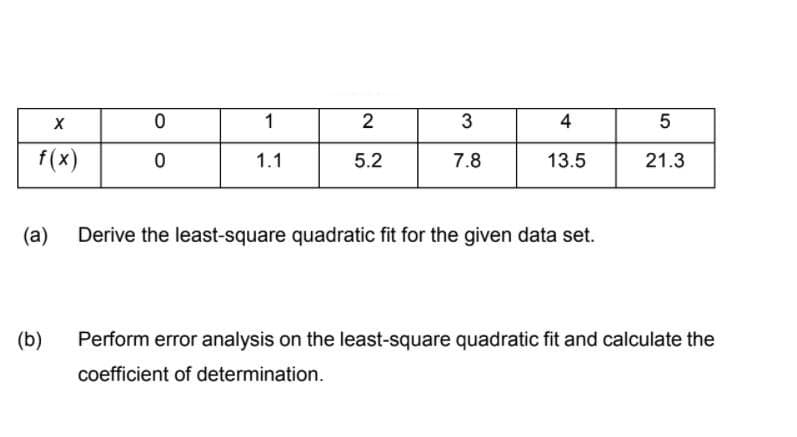
1 3 4 5 f(x) 1.1 5.2 7.8 13.5 21.3 (а) Derive the least-square quadratic fit for the given data set. (b) Perform error analysis on the least-square quadratic fit and calculate the coefficient of determination.


Q: ieh of the following statements is true? a) About 95.3% of the variation in tread depth is explained…
A:
Q: Given the data points listed below, use the method of general least squares to find the expression y…
A: The independent variables are x1, x2. The dependent variable is y. We have to find the value of the…
Q: 2) The following are loads (grams) put on the ends of like plastic rods with the resultin…
A: Solution: x y x2 xy 25 1.58 625 39.5 30 1.39 900 41.7 35 1.41 1225 49.35 40 1.6 1600 64…
Q: (a) Find the best least squares fit by a linear function to the data x −1 0 1 2 y 0 1 3 9 (b) Plot…
A:
Q: A Chi-square Goodness of Fit Test produces a test statistic value x2 = 12.81 with 9 degrees of…
A:
Q: 2. The data in the table represent the weights of various domestic %3D year. For these data, the…
A: Coefficient of Determination: It is a statistical measure commonly used in the testing of hypotheses…
Q: Use five decimal places ax Fit the following data by the equation y= - using the Least squares…
A:
Q: 30 150 25 20 100 15 10 5 50 10 15 20 25 30 35 50 100 150 200 x (age of calf (in weeks)) x (age of…
A:
Q: Below you are given a partial computer output from a multiple regression analysis based on a sample…
A: Null hypothesis: H0: There is no significant relationship among the variables. Alternative…
Q: 1. Copy and paste the data into a statistical software package and determine the equation of the…
A: Here X-Chrips Y- Temperature Temp=2.926* Crips+30.94
Q: For a data set of size 10, the highest order of a polynomial that could be fitted using Least…
A: Solution :-
Q: Which of the following is/are true for a curve-fit using a least-squares regression analysis? Please…
A: We have to choose options which is/are correct with respect to OLS .
Q: In the manufacture of synthetic fiber, the fiber is often “set” by subjecting it to high…
A:
Q: 23 Fit a straight line by the method of least squares to the data given below: Year 1980 1981 1982…
A:
Q: In the presence of autocorrelation, ordinary lease squares (OLS) produce unbiased estimates and…
A: j. Autocorrelation: Autocorrelation is the correlation between the present time series values and…
Q: A quadratic regression was fitted to the data. Parts of the computer output appear below. Predictor…
A:
Q: Which of the following statements is TRUE? I. In multiple linear regression, there should not be…
A: From the above data We are given that the statements I. In multiple linear regression, there should…
Q: 10. Your lab partner decides to incorrectly compute the estimate of the slope parameter for the…
A:
Q: It is known that a natural law obeys the quadratic relationship y = ax-. What is the best line of…
A:
Q: Fit a least squares quadratic curve to the following data and estimate Y at X = 2.4 1 2 3 4 Y 1.7…
A:
Q: The following data pertain to the chlorine residual ina swimming pool at various times after it has…
A: In this case, consider response variable (y) as chlorine residual and predictor variable (x) as…
Q: 1. The problem of finding a line that best "fits" a set of data can be solved using the method of…
A: Given that, A = 115121013514101510; B = 510252040 Then, ATA β0β1β2=ATB We have to find the values…
Q: The t-test on individual model coefficients is a test on the significance of the coefficient of a…
A: When the sample size is small (i.e., less than 30), the central limit theorem does not assure us to…
Q: Mass-Transit Subsidies The following table gives the projected state subsidies (in millions of…
A: The equation for the least square line is y=ax+b where the variables x and y depends upon the vales…
Q: according to table in the image answer the following? Using "Least Squares Method", "b" the slope…
A: Use an online regression calculator and obtain the equation of the given model as follows.…
Q: a. The least squares estimate of βb0, βb1, and the estimated regression line is b. For this model,…
A: (a) The table of calculations is given below; No. x y (x-x¯)2 (y-y¯)2 (x-x¯)(y-y¯) 1 2 1 4 16…
Q: Using the method of Least Squares, determine to 4-decimal place the necessary values of the…
A:
Q: 17.6 Use least-squares regression to fit a straight line to 2 3 4 7 8 1 1.5 2 3 4 8 10 13 (a) Along…
A: Given: x 1 2 3 4 5 6 7 8 9 y 1 1.5 2 3 4 5 8 10 13 To do: Compute the standard error of the…
Q: All of the following statements are false except: O a. All of the given statements are false. Ob.…
A:
Q: (a) Use least-squares regression to fit a linear polynomial to the data given in the table below: 2…
A: Given information: x y 2 411.41 4 412.54 6 413.29 8 414.25 10 414.17 12 415.39 14…
Q: Q.3. Table shows the age in years and the retail value in thousands of dollars of a randor sample of…
A: solution given data x 2 3 3 3 4 4 5 5 5 6 y 28.7 24.8 26.0 30.5 23.8 24.6 23.8 20.4 21.6 22.1…
Q: Given the table of data points x −1 1 2 y 1 3 3 find the best least squares fit by a linear function…
A: The linear function is, f (x) = c1 + c2x Here c1 is the intercept and c2 is the slope. x is…
Q: The method of Least Squares works by fitting the best fit line through which of the following…
A: The method of least square is to minimize the error and error is the sum of the square of dependent…
Q: For a data set of size 10, the highest order of a polynomial that could be fitted using Least…
A: Last option is correct i.e. 9
Q: All of the following statements are false except: O a. All of the given statements are false. Ob.…
A:
Q: Which of the following is true of fixed effect estimators A. The fixed effects estimator is equal…
A: Answer: Option (b) ✔️ The fixed effects estimators are biased if the regression model exhibits…
Q: 11.10 Refer to Exercise 11.9. Create R output and answer the questions instead of using minitab…
A: “Since you have asked multiple questions, we will solve the first question for you. If you want any…
Q: Complete Table 3 and find the values of A and B for the straight line that provides the best…
A: From the given information, The provided data can be shown in the below table; x y 1 2 2 3…
Q: Ising the principle of least-squares Fit curve of the form y=acl+b*) to the given data be lowi- 15…
A: Given fit curve Y= a+bX
Q: 17.6 Use least-squares regression to fit a straight line to 1. 2 3 4. 8. 6. 1.5 2 3 4 5 8. 10 13 (a)…
A:
Q: 14. John's parents recorded his height at various ages between 36 and 66 months. Below is a record…
A: Note: Since you have posted a question with multiple sub-parts, we will solve the first three…
Q: A study of nutrition in developing countries collected data from the Egyptian village of Nahya.…
A: The residual plot in regression analysis determines whether the data best fits the linear model or…
Q: Which of the following statements is TRUE? I. In multiple linear regression, there should not be any…
A: Multiple Linear Regression: In statistics, this measure is used to predict the dependent variable…
Q: 1. The weight in kg (y) of a calf taken at weekly intervals (x) are given below. Fit a straight line…
A: 1st we Enter data in excel . after that calculation as follows
Q: For the following problem, select all answers that are correct. Under certain conditions, minimizing…
A:
Q: Ve five decimal places Fit the following data by the equation y= using the Least squares method 12…
A: The system of equations can be generated with the unknown variables using the data points in the…
Q: When a least squares line is fit to the 8 observations in the fuel consumption data, we obtain SSE =…
A: We know that, Standard deviation=√SSE/(n-1) So s=√SSE/(n-1) And s2= SSE/(n-1)
Q: b) Determine the least squares regression line of the price of the car on mileage travelled. Hence…
A: From the above data From the above output Put x=85 Y=66.91-0.7276*85 Y=5.064 If the milage of…
Q: 7. An individual claims that the fuel consumption of his automobile (y miles per gallon) docs not…
A: Hi! Thank you for the question, As per the honor code, we are allowed to answer three sub-parts at a…

Step by step
Solved in 3 steps

- Design a 3rd order Least-squares function approximation to interpolate between the mid between (2n and 3") for a dataset as chosen by you. Compute the LS model error.Calculate Pearson’s coefficient of skewness. Hence, describe the shape of thedistribution of the waiting time for counter A and B.Suppose we want to compare the length of hospital stay for patients with the same diagnosis at two different hospitals. The results are shown in Table 9.10. 9.7 Why might a t test not be very useful in this case? 9.8 Carry out a nonparametric procedure for testing the hypothesis that lengths of stay are comparable in the two hospitals.
- The t-test on individual model coefficients is a test on the significance of the coefficient of apredictor as if it were the last variable added to a model that already contains all the otherpredictors. (true or false?)A lamp manufacturer company tests the two new models of LED spotlights for commercial use, trying to decide between 2 models.At the moment the useful life tests are carried out as shown in the table.Perform a two-factor LSD discrimination process with an error of 5%The following table shows the percent of water and the number of calories in various canned soups to which 100 g of water are added. (show all the necessary solution) Percent Water in Soups % Water Calories 83.3 28 92.3 26 91.9 39 89.4 57 89.5 57 90.5 36 91.9 32 91.7 32 a. Find the equation of the least squares line for the data. b. Use the equation in part a to find the expected number of calories in a soup that is 87% water. c. Determine the correlation coefficient of the data.
- Find kurtosis by using ungroup data given in the picture using quartile deviation, make sure to arrange data before solving question.To study the effect of alloying on the resistance of electric wires, an engineer plans to measure the resis-tance of n1 = 35 standard wires and n2 = 45 alloyed wires. If it can be assumed that σ1 = 0.004 ohm andσ2 = 0.005 ohm for such data, what can she assert with98% confidence about the maximum error if she usesx1 − x2 as an estimate of μ1 − μ2? (Hint: Use the result ofExercise 8.)Suppose we want to compare the length of hospital stay for patients with the same diagnosis at two different hospitals. The results are shown in Table 9.10. A) Why might a t test not be very useful in this case? B)Carry out a nonparametric procedure for testing the hypothesis that lengths of stay are comparable in the two hospitals
- what is the conventional minimum power a study should have? For a study with this minimum power, what is tthe probablility that you will fail to reject the null hypothesis if the research hypothesis is true?Please fill in the blanks with appropriate answers. - Of all possible estimators of α and β that are linear in the Yi and unbiased, the least squares estimators that have the smallest variances are said to be………………………….…………….……………………………. according to the…..………………………..……………… theorem. - The ……………………………………… is the proportion of the sample variability of the dependent variable explained by its linear relationship with the independent variable. Thanks.The shape of the mean-variance frontier that results from the combination of a riskless and arisky asset is…..:a. Is U-shaped, tilted 90 degrees clockwise.b. Is a straight line passing from the mean-variance points of the two assets.c. Is a hyperbola.d. Consists of two straight lines, each connecting one of the two assets to a risk-freeportfolio
