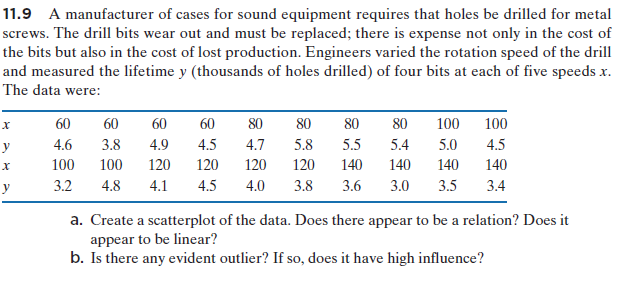
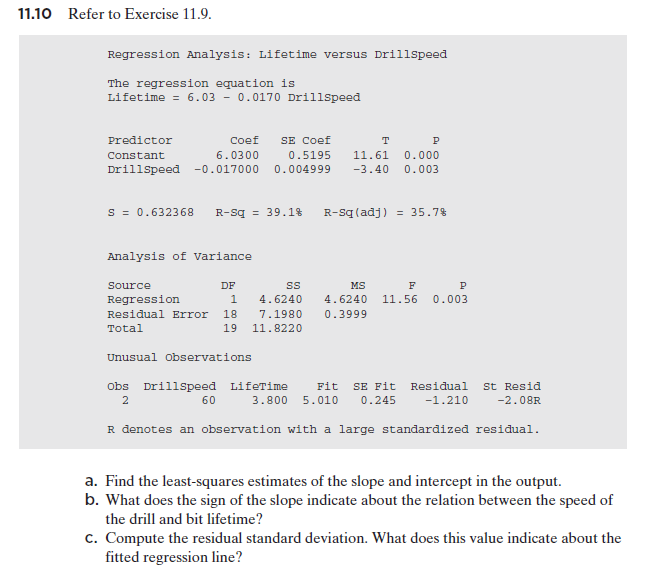
11.10 Refer to Exercise 11.9. Create R output and answer the questions instead of using minitab output) a. Find the least-squares estimates of the slope and intercept in the output. b. What does the sign of the slope indicate about the relation between the speed of the drill and bit lifetime? c. Compute the residual standard deviation. What does this value indicate about the fitted regression line?


Correlation
Correlation defines a relationship between two independent variables. It tells the degree to which variables move in relation to each other. When two sets of data are related to each other, there is a correlation between them.
Linear Correlation
A correlation is used to determine the relationships between numerical and categorical variables. In other words, it is an indicator of how things are connected to one another. The correlation analysis is the study of how variables are related.
Regression Analysis
Regression analysis is a statistical method in which it estimates the relationship between a dependent variable and one or more independent variable. In simple terms dependent variable is called as outcome variable and independent variable is called as predictors. Regression analysis is one of the methods to find the trends in data. The independent variable used in Regression analysis is named Predictor variable. It offers data of an associated dependent variable regarding a particular outcome.
11.10 Refer to Exercise 11.9. Create R output and answer the questions instead of using minitab output)
a. Find the least-squares estimates of the slope and intercept in the output.
b. What does the sign of the slope indicate about the relation between the speed of
the drill and bit lifetime?
c. Compute the residual standard deviation. What does this value indicate about the
fitted regression line?


Trending now
This is a popular solution!

Step by step
Solved in 2 steps


