A study of nutrition in developing countries collected data from the Egyptian village of Nahya. Researchers recorded the mean weight (in kilograms) for 170 infants in Nahya each month during their first year of life. A hasty user of statistics enters the data into software and computes the least-squares line without looking at the scatterplot first. The result is weight = 4.88 +0.267age. %3D 0.50- Use the residual plot to determine if this linear model is appropriate. O No. There is an unequal variability in the residual plot so a linear model is not appropriate for these 0.25 -0.25 data. O Yes. There is an obvious negative-positive-negative pattern in the residual plot so a linear model is appropriate for these data. O Yes. There is equal variability in the residual plot so a lincar model is appropriate for these data. O No. There is an obvious negative-positive-negative pattern in the residual plot so a lincar model is not appropriate for these data. O Yes. The residuals vary from negative to positive values equally in the residual plot so a lincar model is --0.50 -0.75 -1.00 2. 6. 10 12 Age (months) appropriate for these data. umppsə
A study of nutrition in developing countries collected data from the Egyptian village of Nahya. Researchers recorded the mean weight (in kilograms) for 170 infants in Nahya each month during their first year of life. A hasty user of statistics enters the data into software and computes the least-squares line without looking at the scatterplot first. The result is weight = 4.88 +0.267age. %3D 0.50- Use the residual plot to determine if this linear model is appropriate. O No. There is an unequal variability in the residual plot so a linear model is not appropriate for these 0.25 -0.25 data. O Yes. There is an obvious negative-positive-negative pattern in the residual plot so a linear model is appropriate for these data. O Yes. There is equal variability in the residual plot so a lincar model is appropriate for these data. O No. There is an obvious negative-positive-negative pattern in the residual plot so a lincar model is not appropriate for these data. O Yes. The residuals vary from negative to positive values equally in the residual plot so a lincar model is --0.50 -0.75 -1.00 2. 6. 10 12 Age (months) appropriate for these data. umppsə

Linear Algebra: A Modern Introduction
4th Edition
ISBN:9781285463247
Author:David Poole
Publisher:David Poole
Chapter7: Distance And Approximation
Section7.3: Least Squares Approximation
Problem 34EQ

Related questions
Question
Transcribed Image Text:3 of 14 >
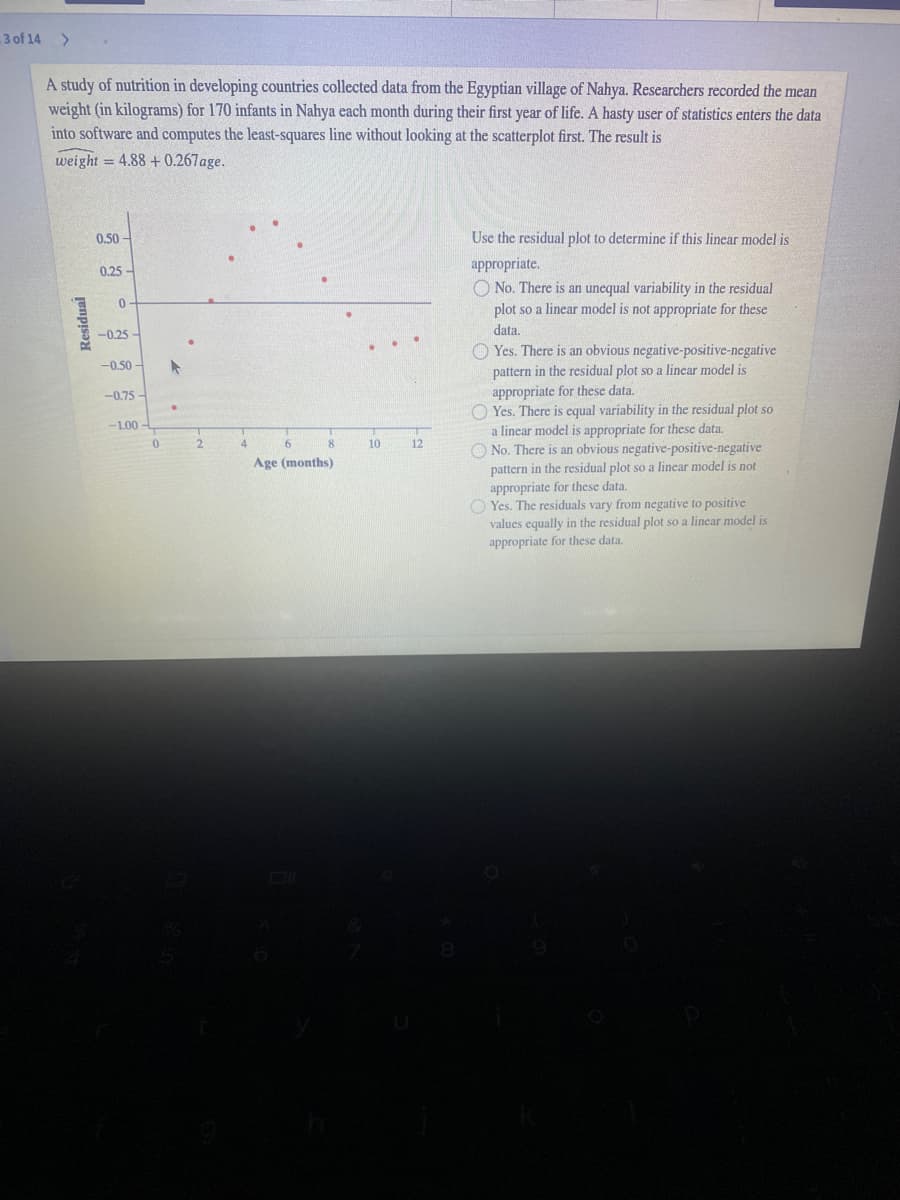
A study of nutrition in developing countries collected data from the Egyptian village of Nahya. Researchers recorded the mean
weight (in kilograms) for 170 infants in Nahya each month during their first year of life. A hasty user of statistics enters the data
into software and computes the least-squares line without looking at the scatterplot first. The result is
weight = 4.88 +0.267age.
0.50 -
Use the residual plot to determine if this linear model is
appropriate.
O No. There is an unequal variability in the residual
plot so a linear model is not appropriate for these
0.25
data.
-0.25
O Yes. There is an obvious negative-positive-negative
pattern in the residual plot so a linecar model is
appropriate for these data.
O Yes. There is equal variability in the residual plot so
a linear model is appropriate for these data.
O No. There is an obvious negative-positive-negative
pattern in the residual plot so a linear model is not
appropriate for these data.
O Yes. The residuals vary from negative to positive
values equally in the residual plot so a linear model is
appropriate for these data.
-0.50 -
-0.75 -
-1.00
8
10
12
Age (months)
Junpisə
Expert Solution
This question has been solved!
Explore an expertly crafted, step-by-step solution for a thorough understanding of key concepts.

This is a popular solution!

Trending now
This is a popular solution!

Step by step
Solved in 2 steps

Recommended textbooks for you
Linear Algebra: A Modern Introduction
Algebra
ISBN:
9781285463247
Author:
David Poole
Publisher:
Cengage Learning

Elementary Linear Algebra (MindTap Course List)
Algebra
ISBN:
9781305658004
Author:
Ron Larson
Publisher:
Cengage Learning
Linear Algebra: A Modern Introduction
Algebra
ISBN:
9781285463247
Author:
David Poole
Publisher:
Cengage Learning
Elementary Linear Algebra (MindTap Course List)
Algebra
ISBN:
9781305658004
Author:
Ron Larson
Publisher:
Cengage Learning