= 1 3. 4 6. 7. 8. 
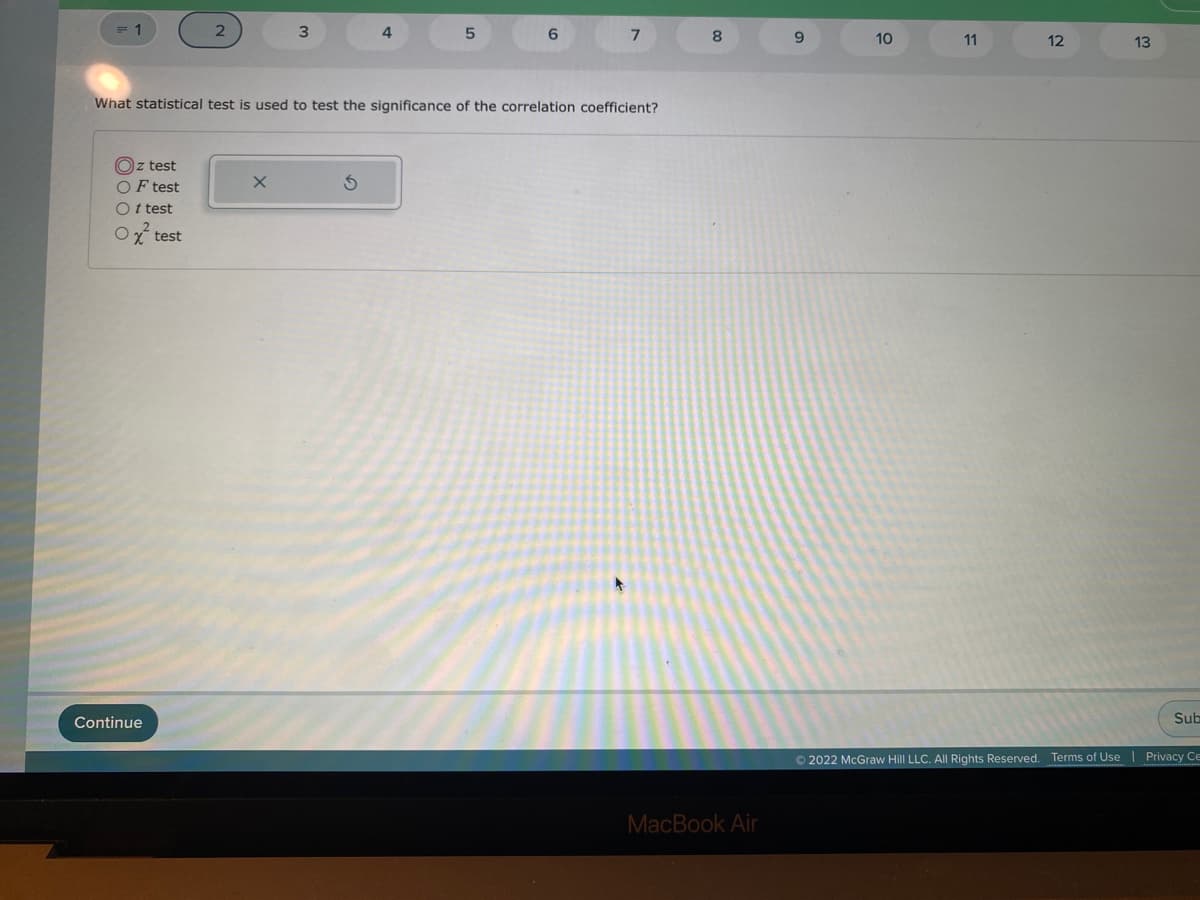
What statistical test is used to test the significance of the correlation coefficient? Oz test OF test O t test Ox test
Q: Among homeowners in a metropolitan area, 70% recycle plastic bottles each week. A waste management…
A: Given n=1700 P=0.70
Q: The claim is that smokers have a mean cotinine level greater than the level of 2.84 ng / mL found…
A: Claim : The smokers have a mean cotinine level greater than the level of 2.84 ng/ml found for…
Q: Clearly indicate with reasons the types of random variable the expression “Heights of people in…
A: Variable in statistics are of different types.
Q: Researchers examined whether playing motion-sensing versus non-motion sensing games would affect…
A:
Q: Complete parts (a) and (b) below given the following confidence interval: 2.23<μ<5.55…
A: Given Upper bound =5.55 Lower bound =2.23 We have to calculate Point estimate and margin of error.
Q: Suppose 1,620 of 2,000 registered voters sampled said they planned to vote for the Republican…
A:
Q: c. Compute the value of the test statistic. t= (Round to two decimal places as needed.) Yiew an…
A:
Q: Suppose the mean of Y is 99. What does the mean of X become if you multiply X by 1.37? (Use two…
A: Given: Mean of random variable xi is =99 If you multiply each xi by 1.37 then the new mean of x?
Q: Provide an appropriate chart for the given data
A:
Q: Suppose we have the following data for two years-1998–99 and 1999–2000. Items 1998–99 (*000 Rs)…
A:
Q: (a) Find the marginal density of X (b) Find the marginal density of Y (c) Find Var[X] (d) Find…
A:
Q: Please answer questions d to g
A:
Q: ather's and Son's Weights A physician wishes to know whether there is a relationship between a…
A: The provided information is x y xy x2 y2 205 9 1845 42025 81 215 14.5 3117.5 46225 210.25…
Q: Assume that the readings at freezing on a bundle of thermometers are normally distributed with a…
A:
Q: Find an estimate of o2 nswers up to two decimal places. ank 1
A: *Answer:
Q: The distribution of heights of adult men is approximately normal with mean 69 inches and standard…
A: As per the Bartleby guildlines we have to solve first three subparts and rest can be reposted....…
Q: Gestation and Average Longevity The data show the gestation period in days and the longevity of the…
A: Solution-: Given: r=0.930,α=0.05 Let, X=Gestation and Y=Longevity Given data: X Y 104 7 288…
Q: 4. 6 6 4 8. 10 12 14 4. The following table shows a person's age and the number of states they have…
A: The regression equation is given by y' = a + bx
Q: (3) The beta parameter is the slope of the line between the predictor and outcome variables. A. TRUE…
A: Given problem Given that The beta parameter is the slope of the line between the predictor and…
Q: Table 3.2 Exports, Imports and Balance of Trade of India, 1993-94 to 1999-2000 (Rs '000 crore)…
A:
Q: How will the MAGNITUDE of the critical value for a two-tailed test compare to the critical value of…
A: here given that comparing critical values of two tails and one tail test for same level of…
Q: A pet store surveyed 420 people to see how many own a dog and how many own a bird. The Venn diagram…
A: From the Venn Diagram: Bird Owners = 188 Dog Owners = 96 Bird and Dog Owners =57 No Bird or no dog…
Q: What is the Type II error probability of this test?
A:
Q: Approximately, what percent of the students scored within A.0 1 standard deviation of the mean? B 1…
A: Since you posted a question with multiple subparts, we will solve first three subparts for you. To…
Q: Happiness Age 62 49 66 67 51 41 71 65 87 84 60 41 86 78 83 18 59 63 36 61 277 8 90 4 70 5 62 15 86…
A: The independent variable is Age. The dependent variable is Happiness. We have to find the test…
Q: Suppose you do a hypothesis testing comparing two population proportions . The calculated P-value…
A:
Q: Four members from a 17-person committee are to be selected randomly to serve as chairperson,…
A: From the provided information, Four members from a 17-person committee are to be selected randomly…
Q: Fifty-four wild bears were anesthetized, and then their weights and chest sizes were measured and…
A:
Q: An artide in the ACI Materials Journal (Vol. 84, 1987, pp. 213-216) describes several experiments…
A: given.data
Q: ANOVA Q60: How old were you when you moved to the United States? Sum of Squares df Mean Square F…
A: From the given information we find the solution.
Q: ese coconuts. Nȳ is hard to get in this case because N is hard to count. How can the total amount…
A: extract grams (x) original grams (y) 1 73 100 2 68 118 3 91 141 4 114 168 5 73 127 6…
Q: reasing size needs to be moved from a start peg to a goal peg using a middle peg as rmediate storage…
A:
Q: the null hypothesis that computer programmers' college major is not related to their programming…
A: Given: Programming capabilities Weak Strong Major Humanities 12 12 Science 12 24…
Q: 3. Let X,..X, be random sample from the probability density function S(x| 4) =e, where -o< u<x<0.…
A: Given that Let X be random sample from the probability density function f(x)=e, where…
Q: what type of correlation analysis is utilized for ice cream consumption?
A: Positive correlation analysis is utilized for ice cream consumption. A positive correlation means…
Q: A artide n the ACI Materials Joumal (vol. 4, 1987, po. 213-216) describes se remove trapped ar…
A: Rodding level Compressive strength observation 10 1530 1530 1440 15 1610 1650 1500 20 1560…
Q: 58 54 65 62 able below with eight (8
A: num X 1 46 2 60 3 40 4 40 5 58 6 57 7 51 8 52 9 63 10 54 11 59 12 58 13 65…
Q: Water and Carbohydrates Here are the number of grams of water and the number of grams of…
A: (1) Use EXCEL to obtain the value correlation coefficient r: EXCEL procedure: Go to EXCEL…
Q: Let to be a specific value of t. Use the table of critical values of t below to find to-values such…
A: Assume the sample is a random sample from a distribution that is reasonably normally distributed
Q: Annual M2 Growth, 1960-2008 14 12 Pereent 10 Avge6.94% 6.
A: The M2 measurement is critical to forecasting.
Q: A vendor specializing in outdoor gear offers customers three ways to place orders for home delivery.…
A: Let X and Y be two discrete random variables defined over the sample space S. Then the function f(x,…
Q: The average price of homes sold in city Depecheville is $245,000. A sample of 144 homes sold in city…
A:
Q: An article in Technometrics by S. C. Narula and J. F. Wellington (Prediction. Linear Regression. and…
A: The independent variable is Taxes. The dependent variable is Sales Price. We have to find the…
Q: Solve the following problems and show your complete solutions. Draw th Exercise 10 Solve the…
A:
Q: The US Department of Energy reported that 48% of homes were heated by natural gas. A random sample…
A: Ho: P= 0.48 Ha: P != 0.48
Q: You measure 37 randomly selected textbooks' weights, and find they have a mean weight of 53 ounces.…
A:
Q: Employee Absences A store manager wishes to see if the number of absences of her employees is the…
A: According to policy we can answer only first 3 part for remaining please repost the question.
Q: According to a certain government agency for a large country, the proportion of fatal traffic…
A:
Q: Today, the waves are crashing onto the beach every 5.6 seconds. The times from when a person arrives…
A:
Q: (a) Let (A, :n E N) be a sequence of events in some sample space 2 Set A- (wefl:wEA, infinitely…
A: Solution: As per the guidelines only first question should be answered since there are multiple…
Trending now
This is a popular solution!
Step by step
Solved in 2 steps with 1 images
- Suppose you want to compute the correlation between overspending behavior and gaming aggression. However, you do not have any access to any of the statistical software. So you decided to compute manually. You got a coefficient of -5.36. What is your interpretation and what should you do? Why?A researcher interested in establishing the relationship between Statistics final examination results of 24 students and their attitude towards their statistics lecturer obtained the following statistical results. i). Giving reasons, comment on the established correlation between the two variables. ii). State the null (H0) and the alternative (H1) hypothesis if the researcher was interested in establishing whether there is a significant correlation. iii). Based on a set alpha level of 0.05, state the conclusion of the hypothesis test?