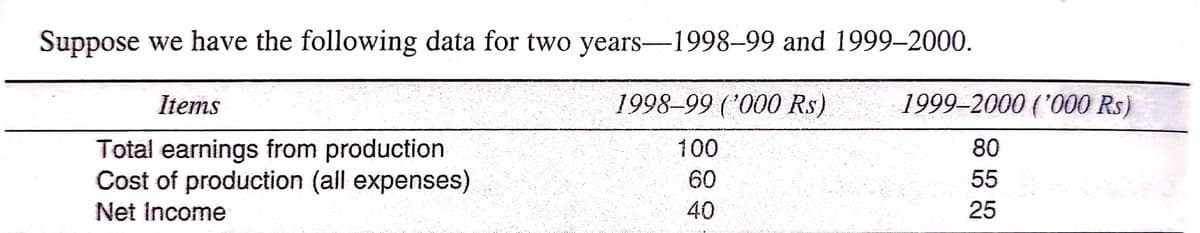
Suppose we have the following data for two years-1998–99 and 1999–2000. Items 1998–99 (*000 Rs) 1999–2000 ('000 Rs) 80 Total earnings from production Cost of production (all expenses) 100 60 55 Net Income 40 25


Q: A pet store surveyed 420 people to see how many own a dog and how many own a bird. The Venn diagram…
A: From the Venn Diagram: Bird Owners = 188 Dog Owners = 96 Bird and Dog Owners =57 No Bird or no dog…
Q: . Suppose we are interested in the relationship between individuals’ place of residence (rural…
A:
Q: An article in the Journal of the American Ceramic Society, "Rapid Hot-Pressing of Ultrafine PSZ…
A: For the given data Find estimate of sigma^2 =?
Q: ather's and Son's Weights A physician wishes to know whether there is a relationship between a…
A: The provided information is x y xy x2 y2 205 9 1845 42025 81 215 14.5 3117.5 46225 210.25…
Q: A professor at a local university conducted a survey of 123 businesses in a city to determine what…
A: A hypothesis which is tested for plausible rejection is called the Null Hypothesis (typically…
Q: b. What is the rejection region? Select the correct choice below and fill in any answer boxes to…
A: here given , A survey found that 65% of college professors believe that their online education…
Q: Assume that there is a positive linear correlation between the variable R (return rate in percent of…
A: Given information: No. of variables=02 Variables under study: 1. Return rate in Percent of a…
Q: 9) O Points: 0 of 1 Part 1 of 3 Save Use the value of the linear correlation coefficient to…
A: Here's, given that r = -0.383
Q: A. Besed on extensive testing, it is determined that the time X in years before a major repair is…
A: Given Data β =4
Q: The Kolmogorov-Smirnov and Anderson-Darling tests are based on the ECDF (Empirical Cumulative…
A: Given the statement: The Kolmogorov-Smirnov and Anderson-Darling tests are based on the ECDF…
Q: Answer the questions using complete sentences. a. What is an influential point? How should…
A:
Q: Question 3 An artide in the Journal of Agricultural Engineering Research (vol. 52, 1992, pp. 53-76)…
A:
Q: (*, – 4) ? 23. What is the value of k=1 (A) mean (B) median (C) zero (D) variance ond conider thes
A:
Q: How strong is the relationship between the average monthly temperature and the number of homicides…
A: The question is based on a correlation Given data :
Q: Let to be a specific value of t. Use the table of critical values of t below to find to-values such…
A: Assume the sample is a random sample from a distribution that is reasonably normally distributed
Q: we’ve decided to create a survey on the population of pet owners in the Bay Area ranging from…
A: The provided information is Number of pets owned Frequency Relative Frequency Cumulative…
Q: we’ve decided to create a survey on the population of pet owners in the Bay Area ranging from…
A: Data is given We have to calculate, mean, median, standard deviation, Histogram..
Q: Identify what is being defined /described in each item. __________1. It is the most basic…
A: The objective is to identify what is being defined/described in each of the given items.
Q: Normal Probability Plot - Data Set A Normal Probability Plot - Data Set C 9.5 7.5 25 90 90 20 00 50…
A: From the above diagram, it can be seen that the In the first figure, the point which is in the red…
Q: How wil the MAGNITUDE of the crtical value for a two-taled test compare to the critical value of the…
A: We need to know, what will be the MAGNITUDE of the critical value for a two-tailed test compare to…
Q: 3. Let X,..X, be random sample from the probability density function S(x| 4) =e, where -o< u<x<0.…
A: Given that Let X be random sample from the probability density function f(x)=e, where…
Q: A psychologist has prepared an “Optimism Test” that is administered yearly to graduating college…
A: From the provided information, Sample size (n) = 10 Population mean (µ) = 17.00
Q: A vendor specializing in outdoor gear offers customers three ways to place orders for home delivery.…
A: Let X and Y be two discrete random variables defined over the sample space S. Then the function f(x,…
Q: According to an airline, flights on a certain route are on time 75% of the time. Suppose 13 flights…
A: Binomial probability is given by P(X=x) = C(n,x)*px*(1-p)(n-x) d) P(fewer than 8 flights are on…
Q: Use the data in the table below to complete parts (a) through (c). 7 7 10 14 18 18 42 30 38 22 25 27…
A: Given data, x y 5 30 7 38 7 22 10 25 14 27 18 22 18 20 42 3
Q: and not 7. The measurements of the drying time, in hours, of a certain brand of latex paint follow a…
A: Solution: Given information: n= 20 Sample size x = 3.77 Sample mean s= 0.946 Sample standard…
Q: 6. A clinical trial was conducted to determinc if a certain type of inoculation has an cffect on the…
A: Given
Q: An article in Technometrics by S. C. Narula and J. F. Wellington (“Prediction, Linear Regression,…
A: Given data is
Q: For the data below, which represents a sample with n = 5, answer the questions. Round to 4 decimal…
A: Given data is x 29.2 11.5 15.4 2.6 6.7
Q: All variables (A BC and Dlare binary and defined to have value 1 if the event happens and O…
A: The logical representation for “If A happens or B happens or C happens then D happens” will be…
Q: Average High Temperature Month Homicides January 32 32 February 38 20 March 47 35 April 59 35 May 70…
A: The following information has been given: Average high temperature(X) Homicide(Y) 32 32 38 20…
Q: a. Compute the p-value of the test. The p-value of the test is (Round to four decimal places as…
A: Here use basic of hypothesis testing
Q: An article in Technometrics by S. C. Narula and J. F. Wellington ("Prediction, Linear Regression,…
A: The objective is to determine the slope and intercept.
Q: You have a theory: people who have a high income (X) are generally healthier (Y). You collect some…
A: Here statement is given Correlation between income and health (positive correlation) But there is…
Q: is y = 46.040x + 18,517.81. Complete parts a and b. Issues, x 419 465 695 494 489 377 71 73 175 165…
A: Given data : X Y 419 17813 465 29049 695 43539 494 30101 489 65970 377 65883…
Q: Continuous Distributions - Data Management Give two examples of normal and uniform distributions;…
A: Here we want to know examples of Normal Distribution and Uniform Distribution.
Q: nd that in each n etric, with one lar ond.
A: There are 3 type of measure of central tendency 1) mean 2) median 3) mode Mean is best measure to…
Q: Which list of measures of central tendency represents the ranking from most to least affected by…
A:
Q: utomotive door latch mechanism (the test was conducted at an elevated lerate the failure). 3062.9…
A: Given Formula Xbar +- E
Q: tive means p, H3, H an tely below.
A: first we will compare A and C here a has one block on 5 and one block on 7 and in case of c there…
Q: Given the following stem-and-leaf plot/diagram. The number occurred the most is A. 22 B. 3 C. 33 D.…
A:
Q: Which value of r indicates a stronger correlation: r= 0.841 orr= - 0.949? Explain your reasoning.…
A:
Q: calculate the least square estimates of slope and intercept? slope? intercept?
A: Use the Excel and Perform the Regression. Followings are the Steps to perform the Regression 1) Open…
Q: Consider testing Họ: H= 20 against Ha:u<20 where u is the mean number of latex gloves used per week…
A:
Q: A artide n the ACI Materials Joumal (vol. 4, 1987, po. 213-216) describes se remove trapped ar…
A: Rodding level Compressive strength observation 10 1530 1530 1440 15 1610 1650 1500 20 1560…
Q: ANOVA Q60: How old were you when you moved to the United States? Sum of Squares df Mean Square F…
A: From the given information we find the solution.
Q: From the data we find that Sxx = 0.11273, Syy = 11,807,324,805, Sxy = 34,422.28. n=29, test the null…
A: Given : Significance level ( α ) = 0.05 Sxx=0.11273 Syy=11807324805 Sxy=34422.28 n=29 Null and alt…
Q: The starting salaries of individuals with an MBA degree are normally distributed with a mean of…
A: According to the given information in this question We need to find the probability that MBA degree…
Q: c. Calculate the value of the test statistic. z= (Round to two decimal places as needed.)
A:
Q: Definitions. Define each of the following concepts. Where relevant, be sure to say what each is…
A: Given that We have to define a.. Expected Cell Frequencies: b) Scatterplot:
Provide an appropriate chart for the following data

Step by step
Solved in 2 steps with 2 images

- The following table shows the average monthly distance traveled (in billion miles) by vehicles on urban highways for five different years. Urban Highways - Average Monthly Distance Traveled by Vehicles (Billion Miles) Years Jan Feb Mar Apr May Jun July Aug Sep Oct Nov Dec Year 1 4.22 5.32 5.21 5.12 4.92 4.49 4.55 4.49 4.44 4.39 4.37 4.35 Year 2 4.31 5.44 5.34 5.24 4.98 4.59 4.68 4.65 4.61 4.68 4.74 4.79 Year 3 4.38 5.51 5.41 5.36 4.98 4.63 4.71 4.78 4.82 4.88 4.85 4.89 Year 4 4.45 5.59 5.5 5.41 5.01 4.72 4.78 4.79 4.82 4.92 5.06 5.11 Year 5 4.51 5.65 5.62 5.49 5.12 4.8 4.88 4.82 4.95 5.12 5.22 5.44 a. Construct a time series plot. What type of pattern exists in the data?Sales of a company (in $100,000) for the last 7 years are listed in the following table. Use the data as given in the table, do not include the hundred thousand at the end of the values.The following table gives profits (in ten thousands of shillings) of two supermarkets over a duration of one year. Determine which supermarket has a greater variability of its profits.
- At the end of 2015, the US Bureau of Economics Analysis posted the following data on the U.S disposable personal income by month for the 11 months of the year as indicated in this tableSuppose that historically, the proportion of people who trade in their old car to a car dealer when purchasing a new car is 48%. Over the previous 6 months, in a sample of 115 new-car buyers, 46 have traded in their old car. To determine whether the proportion of new car buyers that trade in their old car has statistically significantly decreased, what is the p-value? (please round your answer to 4 decimal places)Suppose the following table shows the approximate price of a certain stock in December of each year from 2005 through 2014, as well as the 4-year moving averages for 2005 through 2007.† Complete the table by computing the remaining 4-year moving averages. (Note the peak in 2007 and the drop in subsequent years.) Round each average to the nearest dollar. (Chart in picture)
- Suppose the following table shows the approximate price of a certain stock in December of each year from 2005 through 2014, as well as the 4-year moving averages for 2005 through 2007.† Complete the table by computing the remaining 4-year moving averages. (Note the peak in 2007 and the drop in subsequent years.) Round each average to the nearest dollar.Over the past 40 years, the percentage of homes in the United States with smoke detectors has risen steadily and has plateaued at about 96% as of 2015.† With this increase in the use of home smoke detectors, what has happened to the death rate from home fires? Suppose the following contains 17 years of data on the estimated percentage of homes with smoke detectors and the estimated home fire deaths per million of population. Percentage ofHomes withSmoke Detectors Home Fire Deathsper Millionof Population 0.52 22.8 0.69 20.7 0.76 17.2 0.78 20.4 0.79 19.3 0.84 18.8 0.83 17.5 0.87 16.1 0.88 13.5 0.90 14.3 0.92 14.2 0.94 12.9 0.95 10.8 0.96 10.8 0.97 10.1 0.96 8.3 0.96 8.0 (a) Do you expect a positive or negative relationship between smoke detector use and deaths from home fires? Why or why not? We would expect there would be a ---Select--- negative positive relationship between smoke detector use and deaths from home fires. As more households have…The demand for hand sanitizers is off the charts due to this coronavirus outbreak. People are in desperate need of hand sanitizers. Therefore, FMCGs like Unilever Bangladesh Limited are producing this life-essential product in a bulk amount to help the citizens across Bangladesh to maintain the hygiene standards. Sales figures and profits for the stores are given in the following table. (For the Unit sales, pick any value in between 12-33Units in ascending order). Unit Sales, X Profit (Taka), Y ** 1200 ** 1650 ** 1950 ** 2300 ** 2700 ** 3600 ** 4100 Obtain a regression line for the data. Calculate the profit of a shop for 40 unit sales. Calculate the correlation between unit sales and profit. What is the coefficient of determination of these variables?
- The following table shows the daily receipts in millions of dollars of the movie. “The hunger games” after its opening on march 23 2012. FIND THE AVERAGE RATE OF CHANGE OF THE DAILY RECEIPTS FROM DAY 35 to day 63.Suppose a special type of small data processing firm is so specialized that some have difficulty making a profit in their first year of operation. what is the value of k?how can a meaningful graph be made for data that has the number of cases made each day for one month at a drink manufacturer