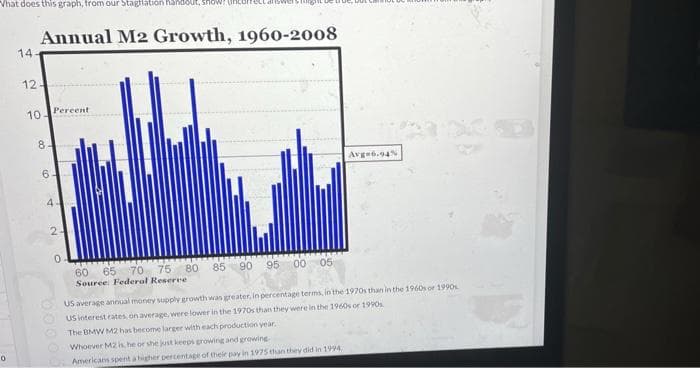
Annual M2 Growth, 1960-2008 14 12 Pereent 10 Avge6.94% 6.


Q: Over of any normally distributed population lies within three standard deviations of the mean O 100%…
A: According to the given information in this question We need to identify the correct option
Q: An article in the Journal of Agricultural Engineering Research (Vol. 52, 1992, pp. 53-76) describes…
A: given data We can find test statistic
Q: Consider the function e^(−x/116.0) . a. Normalize it so that it is a PDF on [0, ∞). b. Compute the…
A: Hi, there! We are allowed to solve first three subparts when the multiple questions are posted.…
Q: How wil the MAGNITUDE of the crtical value for a two-taled test compare to the critical value of the…
A: Here we have given the question about the critical values for one tailed test and two tailed test.…
Q: Happiness Age 62 49 66 67 51 41 71 65 87 84 60 41 86 78 83 18 59 63 36 61 277 8 90 4 70 5 62 15 86…
A: The independent variable is Age. The dependent variable is Happiness. We have to find the test…
Q: Which of the following statements are correct? select as many as correct options you find. Select…
A: Given the 4 statement , Then find the which statement is correct.
Q: Results of the B.Com. Examination of Three Colleges Affiliated to a Certain University College Pass…
A:
Q: 5. The distribution of heights of a certain brecd of terrier has a mean of 72 centimeters and a…
A:
Q: a. If the top 2.5% of all candidates received merit awards, what is the lowest score eligible for an…
A:
Q: Provide an appropriate chart for the given data
A:
Q: 58 54 65 62 able below with eight (8
A: num X 1 46 2 60 3 40 4 40 5 58 6 57 7 51 8 52 9 63 10 54 11 59 12 58 13 65…
Q: The following independent samples from two normally distributed populations were observed. You may…
A: Given data :
Q: se n= 6 and p= 0.25 to complete parts (a) through (d) below. ) Construct a binomial probability…
A: Given: n = 6 p = 0.25 q = 1 - p = 1 - 0.25 = 0.75 X ~ Bin(6,0.25)
Q: . Suppose we are interested in the relationship between individuals’ place of residence (rural…
A:
Q: Whenever we look at the relationship between two variables (regardless of the level of measurement…
A: Given: On looking at the relationship between two variables all are interested in two aspects of…
Q: An article in the Journal of the American Ceramic Society, "Rapid Hot-Pressing of Ultrafine PSZ…
A: For the given data Find estimate of sigma^2 =?
Q: Fifty-four wild bears were anesthetized, and then their weights and chest sizes were measured and…
A:
Q: Two professors at a local college developed a new teaching curriculum designed to increase students'…
A: It is given that n=19 and x=13.
Q: Example 10.17 A population has a normal distribution with an unknown mean and a standard deviation O…
A:
Q: Two separate tests are designed to measure a student's ability to solve problems. Several students…
A: From the provided information, Test A (x) Test B (y) 43 39 65 60 73 62…
Q: Find the (a) first, (b) second, (c) third and (d) fourth moments for the set of numbers
A:
Q: prices of houses in the US is strongly skewed to the right with a mean of $383,500 and a standard…
A: Solution
Q: What are the assumptions for regression analysis? Select all that apply. The sample is a random…
A: The assumptions for regression analysis :
Q: Assume that the readings at freezing on a bundle of thermometers are normally distributed with a…
A:
Q: a) Estimate the intercept Bo and slope B1 regression coefficients. Write the estimated regression…
A: Since you have posted a question with multiple sub-parts, we will solve first three sub- parts for…
Q: The starting salaries of individuals with an MBA degree are normally distributed with a mean of…
A: According to the given information in this question We need to find the probability that MBA degree…
Q: Our cla orded the temperature at noon each day for 21 school days in the spring. The lowest…
A: Given the temperature at noon each day for 21 school days in the spring. The lowest temperature (in…
Q: In the game of roulette, a player can place a $4 bet on the number 9 and have a probability of…
A:
Q: (a) the sixth person to hear this tale is the fourth one to believe it? (b) the third person to hear…
A: here given, Suppose the probability that any given person will believe a tale about the…
Q: 2. The price of a stock on each day either moves up $1 with probability 0.4 or moves down $1 with…
A: Given that, The price of a stock on each day either moves up $1 with a probability of…
Q: All variables (A BC and Dlare binary and defined to have value 1 if the event happens and O…
A: The logical representation for “If A happens or B happens or C happens then D happens” will be…
Q: Zoologists investigated the reproductive traits of spider mites with an infection. Male and female…
A: Hello! As you have posted more than 3 sub parts, we are answering the first 3 sub-parts. In case…
Q: Employee Absences A store manager wishes to see if the number of absences of her employees is the…
A: According to policy we can answer only first 3 part for remaining please repost the question.
Q: (3) The beta parameter is the slope of the line between the predictor and outcome variables. A.…
A: Since you asked multiple questions, we will solve the first question for you. If you want any…
Q: Zappos is an online retailer based in Nevada and employs 1,300 employees. One of their competitors,…
A: The sample mean is 33.9 and the sample standard deviation is 4.1.
Q: An article in the Journal of the American Ceramic Society, "Rapid Hot-Pressing of Ultrafine PSZ…
A:
Q: Example 10.13 It has been found that 7 per cent of the tools manufactured by a factory are…
A:
Q: Determine the areas under the normal curve given the mean of the distribution u = 80 and o = 5.5,…
A: Hello! As you have posted more than 3 sub parts, we are answering the first 3 sub-parts. In case…
Q: The paired data below consists of test scores and hours of preparation for 5 randomly selected…
A:
Q: The graph of a normal curve is given on the right. Use the graph to identify the values of u and o.…
A: See the handwritten solution
Q: The table below lists the mean systolic blood pressure during surgery (mmHg) along with blood loss (…
A:
Q: An article in the Journal of Agricultural Engineering Research (Vol. 52, 1992, pp. 53-76) describes…
A: Anova shows two source of variation, they are between treatment variation and within treatment…
Q: Find the proportion of the normal distribution that is associated with the following sections of a…
A:
Q: A game is player with a pair of tetrahedral ( four sided) dice. Each die has four faces numbered…
A: if a pair 4 sided die is rolled than the possible outcomes…
Q: Given the following stem-and-leaf plot/diagram. The number occurred the most is A. 22 B. 3 C. 33 D.…
A:
Q: Is the proportion of wildfires caused by humans in the south different from the proportion of…
A: GivenFor wildfires looked at in the southn1=567x1=452p1^=x1n2=452567≅0.7972For wildfires looked at…
Q: The following are distances (in miles) traveled to the workplace by 20 employees of a certain…
A: Here's first we will arrange in ascending order all observation then use formula.
Q: The paired data below consists of test scores and hours of preparation for 5 randomly selected…
A: strong positive correlation.
Q: An article in the Joumal of Seund and Vibranon (Vel. 151, 1991, pe. 303-94) cescribed a study…
A: For the given data Intercept = ?
Q: A book contains 500 pages. If there are 200 typing errors randomly distributed throughout the book,…
A:

Step by step
Solved in 2 steps

- Go to the St. Louis Federal Reserve FRED databaseand find data on the M1 money supply (M1SL) andthe 10-year treasury bond rate (GS10). Add the twoseries into a single graph by using the “Add DataSeries” feature. Transform the M1 money supplyvariable into the M1 growth rate by adjusting theunits for the M1 money supply to “Percent Changefrom Year Ago.”a. In general, how have the growth rate of theM1 money supply and the 10-year treasurybond rate behaved during recessions andduring expansionary periods since the year2000?b. In general, is there an obvious, stable relationship between money growth and the10-year interest rate since the year 2000?c. Compare the money growth rate and the10-year interest rate for the most recentmonth available to the rates for January2000. How do the rates compare?prepare a line graph and examine the relationship observe between the two countries Years Growth rate Unemployment rate % Trinidad and Tobago Japan Trinidad and Tobago Japan 2016 -5.6 0.8 3.2 3.1 2017 -3.0 1.7 3.3 2.8 2018 0.1 0.6 3.0 2.2 2019 -1.2 0.3 3.76 2.4 2020 -7.8 -5.8 6.74 2.94Briefly explain homoscedasticity and heteroscedasticity or draw a graph illustrating these.
- The following graph shows a rough approximation of historical and projected median home price is for a country for the period 2000-2024 (a) The median home price peaked at the start of the year ____ at $______ thousand. (b) The median home price was decreasing most rapidly at the start of the year ______ when it was $______thousand, and increasing most rapidly at the start of the year ______ when it was $_____thousand. Assuming that the trend shown in the graph continued indefinitely, the median home price would approach the value of $______thousand in the long term.A developing country's economy is based on exporting raw materials to the United States . The country sells raw materials for U.S. dollars and converts them to its own currency at current exchange rates. The table shows these exchange rates for the years 1990 to 2020 . Based on the graph, which conclusion best describes the country's economic situation between 1990 and 2000?About the size of New Jersey, Israel has seen its population soar to more than 6 million since it was established. The given graphs show that by 2050, Palestinians in the West Bank, Gaza Strip, and East Jerusalem will outnumber Israelis. Solve the projected growth of these two populations as given below, a. In 2000, the population of the Palestinians in the West Bank, Gaza Strip, and East Jerusalem was approximately 3.2 million and by 2050 it is projected to grow to 12 million. Use the exponential growth model A = A0ekt, in which t is the number of years after 2000, to find the exponentialgrowth function that models the data. b. In which year will the Palestinian population be 9 million?
- Storrs Cycles has just started selling the new Cyclonemountain bike, with monthly sales as shown in the table. First,co-owner Bob Day wants to forecast by exponential smoothingby initially setting February’s forecast equal to January’s saleswith a = .1. Co-owner Sherry Snyder wants to use a three-periodmoving average. a) Is there a strong linear trend in sales over time?b) Fill in the table with what Bob and Sherry each forecast forMay and the earlier months, as relevant.c) Assume that May’s actual sales figure turns out to be 405.Complete the table’s columns and then calculate the meanabsolute deviation for both Bob’s and Sherry’s methods.d) Based on these calculations, which method seems moreaccurate?Researchers have surveyed college freshmen every year since 1969. The Figure graph (attached herewith) shows that attitudes about some life goals have changed dramatically over the years. In particular, the freshman class of 2013 was more interested in making money than the freshmen of 1969 had been. In 1969, 42% of first-year college students considered “being well-off financially” essential or very important. For the period from 1969 through 2013, this percentage increased by approximately 0.9 each year. If this trend continues, by which year will all college freshmen consider “being well-off financially” essential or very important?B3 Calculate (predict) t = 11 for each trend method. Create a Linear prediction for Federal Debt-GDP = Create an Exponential prediction for Federal Debt-GDP = Create a Polynomial (order 5) prediction for Federal Debt-GDP = Year t Federal Debt - GDP 2011 1 96.018 2012 2 100.061 2013 3 100.810 2014 4 102.818 2015 5 100.246 2016 6 105.337 2017 7 104.806 2018 8 105.632 2019 9 107.047 2020 10 128.332
- Determine the net change between the indicated points on the graph?A researcher evaluated the effectiveness of relaxation training in reducing anxiety. One sample of anxiety ridden people received relaxation training, while a second sample did not. Then anxiety scores were measured for all subjects, using a standardized test. Use the information summarized in the following table to complete this item. The Effect of Relaxation Training on Anxiety Scores Group Mean Anxiety Score SE Control group 36 7 Relaxation training 18 5 Construct a graph (by hand) that incorporates all the information in this table. Looking at your graph, do you think that the relaxation training really worked. Explain your answer.Coffee Time wants to show how their profits have increased over the past two years. Which graph would be best?
