1) A researcher is interested in studying if a higher percentage of male sailors smoke then female sailors. She collects a sample of 200 male sailors, and finds that 125 of them smoke. She collects a sample of 150 female smokers and finds that 56% of the, smoke. Answer the following question to test her claim with a 5% significance level. a) Mean or proportions? b) Which Distribution will you use? Fill in the following chart with the values given in the problem: How do you know? Why? Notation Value Write the following in symbols: Ho: n2 H,: Use Chart/ Technology as necessary to find the following: Critical Value(s): X1 X2 Test Statistic: p-value: Initial Conclusion: Reject Null hypothesis/ Fail to reject null hypothesis (Circle one) Clearly Identify CV(s), TS, p-value, and rejection region. Formal Conclusion (What does the result tell you about the populations):
1) A researcher is interested in studying if a higher percentage of male sailors smoke then female sailors. She collects a sample of 200 male sailors, and finds that 125 of them smoke. She collects a sample of 150 female smokers and finds that 56% of the, smoke. Answer the following question to test her claim with a 5% significance level. a) Mean or proportions? b) Which Distribution will you use? Fill in the following chart with the values given in the problem: How do you know? Why? Notation Value Write the following in symbols: Ho: n2 H,: Use Chart/ Technology as necessary to find the following: Critical Value(s): X1 X2 Test Statistic: p-value: Initial Conclusion: Reject Null hypothesis/ Fail to reject null hypothesis (Circle one) Clearly Identify CV(s), TS, p-value, and rejection region. Formal Conclusion (What does the result tell you about the populations):

College Algebra (MindTap Course List)
12th Edition
ISBN:9781305652231
Author:R. David Gustafson, Jeff Hughes
Publisher:R. David Gustafson, Jeff Hughes
Chapter8: Sequences, Series, And Probability
Section8.7: Probability
Problem 6E: List the sample space of each experiment. Tossing three coins

Related questions

Question
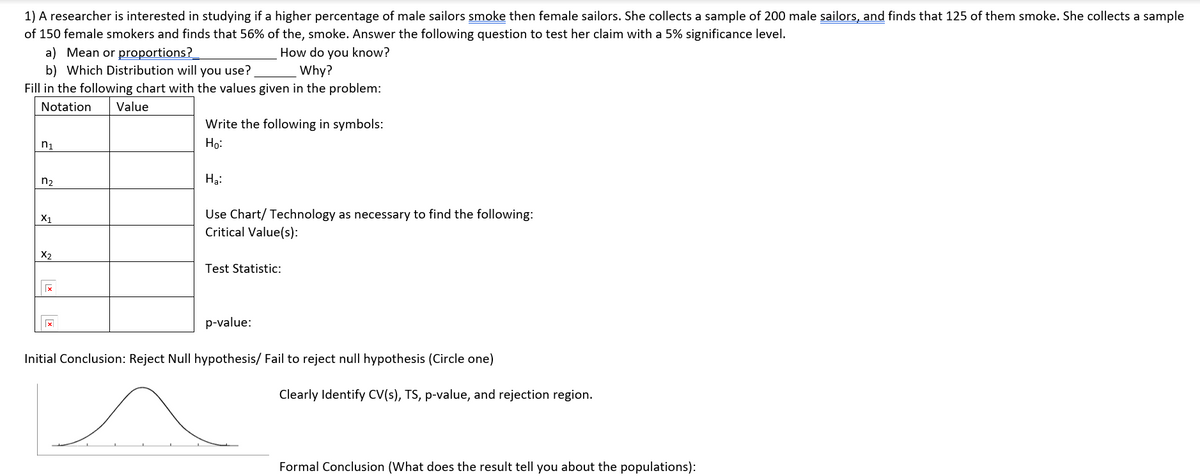
Transcribed Image Text:1) A researcher is interested in studying if a higher percentage of male sailors smoke then female sailors. She collects a sample of 200 male sailors, and finds that 125 of them smoke. She collects a sample
of 150 female smokers and finds that 56% of the, smoke. Answer the following question to test her claim with a 5% significance level.
a) Mean or proportions?_
b) Which Distribution will you use?
How do you know?
Why?
Fill in the following chart with the values given in the problem:
Notation
Value
Write the following in symbols:
n1
Ho:
n2
Hạ:
Use Chart/ Technology as necessary to find the following:
Critical Value(s):
X1
X2
Test Statistic:
p-value:
Initial Conclusion: Reject Null hypothesis/ Fail to reject null hypothesis (Circle one)
Clearly Identify CV(s), TS, p-value, and rejection region.
Formal Conclusion (What does the result tell you about the populations):
Expert Solution
This question has been solved!
Explore an expertly crafted, step-by-step solution for a thorough understanding of key concepts.

This is a popular solution!

Trending now
This is a popular solution!

Step by step
Solved in 7 steps with 2 images

Knowledge Booster


Learn more about
Need a deep-dive on the concept behind this application? Look no further. Learn more about this topic, statistics and related others by exploring similar questions and additional content below.Recommended textbooks for you
College Algebra (MindTap Course List)
Algebra
ISBN:
9781305652231
Author:
R. David Gustafson, Jeff Hughes
Publisher:
Cengage Learning

Glencoe Algebra 1, Student Edition, 9780079039897…
Algebra
ISBN:
9780079039897
Author:
Carter
Publisher:
McGraw Hill

College Algebra (MindTap Course List)
Algebra
ISBN:
9781305652231
Author:
R. David Gustafson, Jeff Hughes
Publisher:
Cengage Learning
Glencoe Algebra 1, Student Edition, 9780079039897…
Algebra
ISBN:
9780079039897
Author:
Carter
Publisher:
McGraw Hill