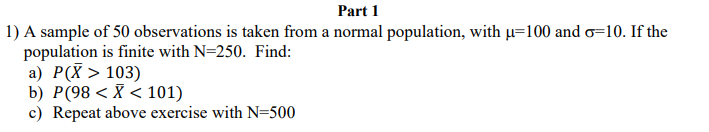
1) A sample of 50 observations is taken from a normal population, with µ=100 and o=10. If the population is finite with N=250. Find: a) P(X > 103) b) P(98 < X < 101) c) Repeat above exercise with N=500


Q: 2. To test the null hypothesis pi = P2 with two independent samples of sizes nį and n2, we require…
A: Using 2 prop Z test it can be solved
Q: Suppose we take a random sample of size n from Bi(m.p). Find the CDF and PMF of X(?).
A: Given information: A random sample of size n follows binomial distribution with parameters m and p.
Q: An interval within which we expect 95% of all xx's to fall can be defined for any population by…
A: Given that An interval within which we expect 95% of all xx's to fall
Q: A humane society claims that less than 73% of households in a certain country own a pet. In a…
A: A random sample of 700 households in that country, 490 say they own a pet. n=700 x=490 α=0.01
Q: If the sampled population is finite and at least _____ times larger than the sample size, we treat…
A: As a rule of thumb, any population that is 20 times larger than the sample size is considered as…
Q: 7. In an experiment to test iron strengths, three different ores, four different furnace…
A:
Q: If X,, X2,...,X, constitute a random sample of size n from a population with p.d.f. given by .....…
A: Find MLE of θ
Q: Suppose that a population is known to be normally distributed with u = 2,000 and o = 230. If a…
A: Given data,μ=2000σ=230If n=8P(X>2100)=?
Q: Suppose a simple random sample of size n-10 was drawn from a population of size N=1000 and the…
A:
Q: Consider two perceptrons defined by the threshold expression True or false? Perceptron A is more…
A: Consider the given threshold expression, ω0+ω1x1+ω2x2>0 Here we have given that the perception A…
Q: Find the sampling distribution of Y1 for random sam-ples of size n = 2 taken (a) without replacement…
A:
Q: A research center claims that that 31% of adults in a certain country would travel into space on a…
A: The null and alternative hypotheses are given below.
Q: A newspaper article about the results of a poll states: "In theory, the results of such a poll, in…
A: Given:Confidence level = 0.99Z for 99% confidence level = 2.576 …using z-table
Q: Suppose that trees are distributed in a forest according to a two-dimensional Poisson process with…
A: Given: Expected number of trees per acre = 80
Q: 1. Assume that X1, X2,..., X40 form a random sample from a geometric distribution with p 0.2. (a)…
A: Solution
Q: If X1 and X2 constitute a random sample of size n = 2from a Poisson population, show that the mean…
A: Sufficient Estimator: An estimator is said to be sufficient, if the statistic used as an estimator…
Q: 1. A snack food production manager at a company wants to release a new product. In order for the…
A: Given data :…
Q: A research center claims that at least 22% of adults in a certain country think that their taxes…
A:
Q: All random samples of size n = 9 are selected from a normal population with u = 55 and o = 10, and…
A:
Q: 5. Suppose that the probability of a defect in a foot of magnetic tape is 0.002. Use the Poisson…
A: As per our guidelines we are supposed to answer only one question per post so i am solving first…
Q: 2. Consider the floating point numbers with B = 3,p =4, –2ses 3. What is the minimum and the maximum…
A: Consider the provided question, Consider the floating point numbers with β= 3, p=4, -2 ≤e≤3. We need…
Q: If X1, X2, X, is a random sample from an exponential population having mean 1 find the exact…
A:
Q: Let x, x2,x, be a random sample of size (n) taken from Poisson( 0), and y = "x, then F(x1, x2, X,…
A: The answer is given using the formula of Poisson distribution.
Q: If X1, X2, ... , Xn constitute a random sample from anormal population with μ = 0, show that…
A: It is given that X1, X2, …, Xn is a random sample of the normal population with N(0, σ2). That is,…
Q: Prove that for a random sample of size n, X, X2 X, taken from a finite population s - (, - i) Σ n…
A:
Q: Find the minimum sample size n needed to estimate muμ for the given values of c, sigmaσ, and E.…
A: Population standard deviation, sigma is 9.1. The z-critical value for 90% confidence interval is…
Q: 26 Use Theorem 6.6.5 to establish that, given a sample X1,...,Xn, the following statistics are…
A: Given that -
Q: Suppose s random sample X, X2, ..., X, of size n is taken from a population with p.d.f 1 f(x;0) = e…
A: a. From the given information, fx,θ=1θ+1e-xθ+1, 0<x<∞, θ>-1 =1θ+1e-xθ+1,…
Q: A random sample of size n = 100 is taken from an infinite population with the mean μ = 75 and the…
A:
Q: If a sample size is 84, comes from a population that is normally distributed, and the data is…
A: The assumptions of t-test are given as follows: The first assumption is that the scale of…
Q: Show that YN = Nỹn is unbiased for Yy. That is, show that E[ YN]= YN -
A:
Q: Let X1 and X2 constitute a random sample from a nor-mal population with σ2 = 1. If the null…
A:
Q: Find the minimum sample size n needed to estimate muμ for the given values of c, sigmaσ, and E.…
A:
Q: Show that for a random sample of size 2 from N (0, ơ²) population, E[Xq„] = - o/Vr.
A:
Q: Suppose X1, .,Xn is a random sample from a N (H, o²) opulation, and independently, Y, ....,Ym is a…
A: Hello! As you have posted more than 3 sub parts, we are answering the first 3 sub-parts. In case…
Q: A simple random sample of size n= 65 is obtained from a population with u = 57 and o = 5. (a) Does…
A: We have to find given probability.
Q: Suppose that Fred, a United States politician from a large western state, wants to create a new law…
A: Binomial distribution: A discrete r.v. X taking values 0,1,2,3, …., n is said to follow a binomial…
Q: Let X1, X2, ... , Xn be a random sample, normally distributed with mean μ and variance σ2 If σ2 is…
A:
Q: Suppose that independent Bernoulli trials with parameter p are performed successively. Let N be the…
A: To find : P(N=n)=xnP(X=x)
Q: The manufacturer of a certain voltmeter claims that 95% or more of its readings are within 0.1% of…
A: Note: Hey there! Thank you for the question. As you have posted two independent questions, according…
Q: 3 of 25 (2 complet Find the minimum sample size n needed to estimate u for the given values of c, G,…
A:
Q: Find the minimum sample size n needed to estimate muμ for the given values of c, sigmaσ, and E.…
A: It is given that confidence level is 0.90, standard deviation is 7.3 and margin of error E is 2.
Q: Suppose that discrete random variable X~uni[1,2,3] A random sample of n=36 is selected from this…
A: The question is about sampling dist. Given : X ~ uni [ 1, 2, 3 ] Sample size ( n ) = 36 To find :…
Q: Suppose X-N(18,25 ) and Y~N(19,16 ) . If a sample of size 25 was selected from the X population and…
A: Using the theory of Sampling Distribution of Sample Mean.............
Q: For a population with μ = 25 and σ = 5, we would expect 90% of all xx's calculated from n = 35 to…
A:
Q: If X1, X2, and X3 constitute a random sample of sizen = 3 from a Bernoulli population, show that Y…
A: X1,X2,X3 are same from a Bernoulli distribution. Y=X1+2X2+X3 Let X1,X2,X3 are from Bernoullip.
Q: 3. Use the Simpson's rule to estimate 7e 2xdx with n = 6
A: Since you have asked multiple questions we will solve the first question for you. If you want to be…
Q: Let X1, X2, ... , Xn be a random sample, normally distributed with mean μ and variance σ2 If σ2 is…
A: Given: confidence level = 0.95 Margin of error E = σ4 Formula Used: n = Zα/2×σE2

Step by step
Solved in 3 steps with 3 images

- 6. A research center claims that at least 30% of adults in a certain country think that their taxes will be audited. In a random sample of 1200 adults in that country in a recent year, 26% say they are concerned that their taxes will be audited. At α=0.10, is there enough evidence to reject the center's claim? Complete parts (a) through (e) below. Question content area bottom Part 1 (a) Identify the claim and state H0 and Ha. Identify the claim in this scenario. Select the correct choice below and fill in the answer box to complete your choice. (Type an integer or a decimal. Do not round.) A. enter your response here % of adults in the country think that their taxes will be audited. B. The percentage of adults in the country who think that their taxes will be audited is not enter your response here %. C. At least 30 30% of adults in the country think that their taxes will be audited. Your answer is correct. D. Less than…Suppose that a random sample of size 1 is to be taken from a finite population of size N. a. How many possible samples are there?b. Identify the relationship between the possible sample means and the possible observations of the variable under consideration.c. What is the difference between taking a random sample of size 1 from a population and selecting a member at random from the population?Chapter 6, Section 4-HT, Exercise 212 Use the t-distribution and the given sample results to complete the test of the given hypotheses. Assume the results come from random samples, and if the sample sizes are small, assume the underlying distributions are relatively normal.Test H0 : μT=μC vs Ha : μT<μC using the fact that the treatment group (T) has a sample mean of 8.6 with a standard deviation of 4.1 while the control group (C) has a sample mean of 11.2with a standard deviation of 3.4. Both groups have 25 cases. (a) Give the test statistic and the p-value.Round your answer for the test statistic to two decimal places and your answer for the p-value to three decimal places.test statistic = p-value = (b) What is the conclusion of the test at a 5% significance level? Reject H0. Do not reject H0.
- Chapter 6, Section 3-CI, Exercise 146 Public Libraries and GenderA survey1 asked a random sample of n=2752 US adults whether they had visited a public library in the last 12 months. The results for males and females are shown in the table below. Yes No Total Females 726 697 1423 Males 505 824 1329 Total 1231 1521 2752Table 1: Have you visited a public library in the last year? 1Rainie, L., “Libraries and Learning,” www.pewinternet.org/2016/04/07/libraries-and-learning/, Pew Research Center, April 7, 2016. (a) Find p^f and p^m, the sample proportions who have visited a public library in the last 12 months, for females and males respectively. What is the difference in sample proportions p^f-p^m?Round your answers to three decimal places.p^f= p^m= p^f-p^m= (b) Find a 99% confidence interval for the difference in population proportions pf-pm.Round your answers to two decimal…Suppose that a sample is to be taken without replacement from a finite population of size N. If the sample size is the same as the population size, a. how many possible samples are there? b. what are the possible sample means? c. what is the relationship between the only possible sample and the population?The table below summarizes data from a survey of a sample of women. Using a 0.01significance level, and assuming that the sample sizes of 800 men and 300 women are predetermined, test the claim that the proportions of agree/disagree responses are the same for subjects interviewed by men and the subjects interviewed by women. Does it appear that the gender of the interviewer affected the responses of women? Gender of Interviewer Man Woman Women who agree 498 247 Women who disagree 302 53 Compute the test statistic, rounding to three decimal places. Find the critical value(s). (Round to three decimal places) What is the conclusion based on the hypothesis test?
- The continuous timing method in direct time study was used to obtain the element timesfor a worker-machine task as indicated in the table below. Element c is a machine-controlledelement and the time is constant. Elements a, b, d, e, and f are operator-controlled andexternal to the machine cycle, and they were performance rated at 80%. If the machineallowance is 25%, and the worker PFD allowance is 15%, determine (a) the normal time,(b) the standard time for the cycle, and (c) the worker’s efficiency if the worker completes360 work units working 7.2 hr on an 8-hour shift.Two sample sizes of 15 and 10 were taken from a male and a female population, respectively. What is the corresponding degrees of freedom of the given samples?A. The results of such a cross were 10 red-, 21 pink-, and 9 white-flowered offspring. Do these results differ significantly (at a 5% level) from the expected frequencies? B. In another, larger experiment, you count 100 times as many flowers as in the experiment in part (a) and get 1000 red, 2100 pink, and 900 white. Do these results differ significantly from the expected 1:2:1 ratio? C. Do the proportions observed in the two experiments [i.e., in parts (a) and (b)] differ? Did the results of the two hypothesis tests differ? Why or why not?
- Chapter 6, Section 5, Exercise 236 Use a t-distribution and the given matched pair sample results to complete the test of the given hypotheses. Assume the results come from random samples, and if the sample sizes are small, assume the underlying distribution of the differences is relatively normal. Assume that differences are computed using d=x1-x2.Test H0 : μd=0 vs Ha : μd≠0 using the paired difference sample results x¯d=10.51, sd=11.6, nd=25. Give the test statistic and the p-value.Round your answer for the test statistic to two decimal places and your answer for the p-value to three decimal places.test statistic = Enter your answer; test statisticp-value = Enter your answer; p-value Give the conclusion using a 5% significance level. Reject H0. Do not reject H0.Suppose a simple random sample of size n equals 1000 is obtained from a population whose size is N equals 2 comma 000 comma 000 and whose population proportion with a specified characteristic is p equals 0.75. Complete parts (a) through (c) below.


