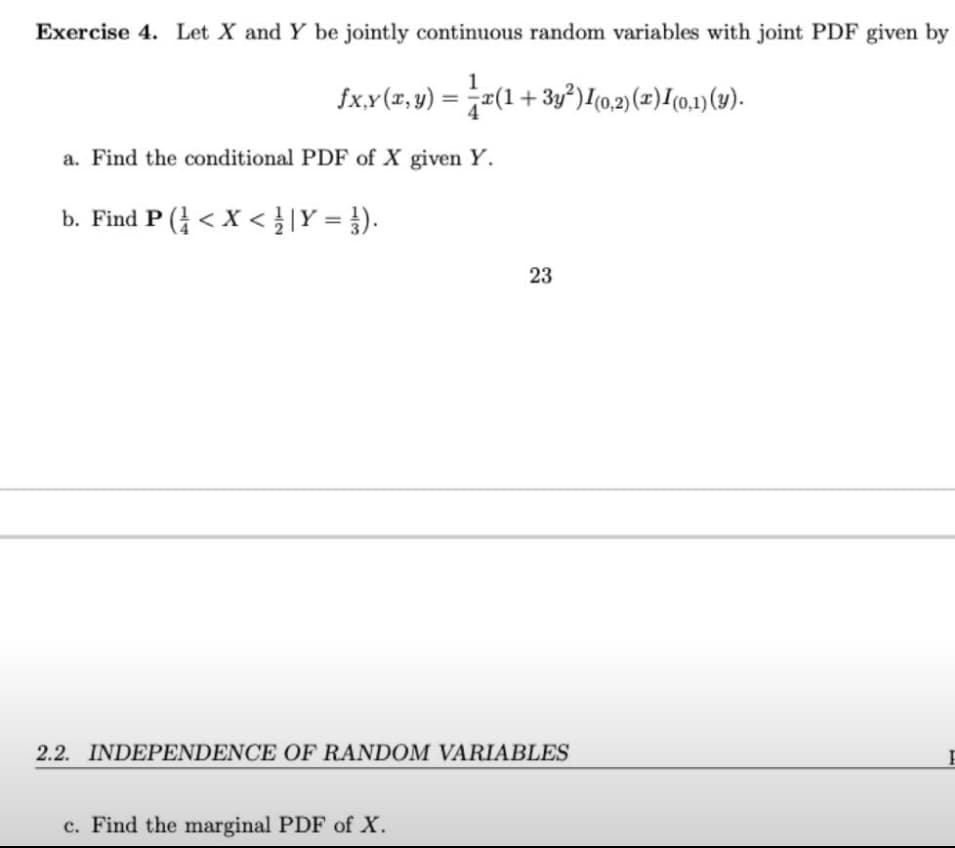
1 ƒx,y(x, y) = x(1 + 3y²)I(0,2)(x) 1 (0,1) (y). a. Find the conditional PDF of X given Y. b. Find P (< X < / | Y = }). 23 2.2. INDEPENDENCE OF RANDOM VARIABLES c. Find the marginal PDF of X.


Q: Solve the following 1.) The following data were obtained in a study of the relationship between the…
A:
Q: An oil company conducts a geological study that indicates that an exploratory oil well should have a…
A: Geometric distribution: The probability mass function of Geometric distribution is P(n) = p(1 - p)n…
Q: of Homogeneity of Variances df1 df2 54 oups ps 3 Sum of Squares 76 Sig. .052 ANOVA df Contrast…
A: *Answer:
Q: A mechanic a brand of automobile tire that has a expectancy that is normally distributedwith a mean…
A:
Q: Disks of polycarbonate plastic from a supplier are analyzed for scratch and shock resistance. The…
A: Given 151 disk
Q: Consider a medical practitioner pondering the following dilemma: "If I'm at least 80 percent certain…
A: Given: Probability that Jones has the disease is 60%. Let D denote the event that Jones has the…
Q: Suppose data on root length (in mm) were obtained from roots from the three set-ups: (1) negative…
A: Inferential Statistics: This part of statistics deals with making conclusions from the analysis.…
Q: A data set consist of 2,2,3,4,5,5 and 7. Then 20 is added to the data set. The new value will havw…
A: Mean, median, and mode are the three measures of central tendency.
Q: In an attempt to assess the effect of the student's score in the admission test to their academic…
A: The provided information is Sore in admission test x Grade y xy x2 52 80 4160 2704 61 78…
Q: A group of automotive engineers decided to conduct a study of its school buses and found that for 32…
A: (a) Obtain the margin of error at the 99% confidence interval for the mean. The margin of error at…
Q: Records of the past 15 years have shown the average revenue of company A for the month of March to…
A: Introduction: Denote μ1, μ2 as the true average revenues (M pesos) of Companies A and B,…
Q: Here is a sample data set. 348.5 354 361 365.5 380 413.2 417.4 439.1 445 468.8 472.7 473.9 477.3…
A: arrange the data in ascending order ascending order is: [348.5, 354.0, 361.0, 365.5, 380.0,…
Q: Aisha wants to advertise how many chocolate chips are in each Big Chip cookie at her bakery. She…
A: It is given that Sample mean = 5.1 Sample standard deviation = 3.5 Sample size = 44 Confidence level…
Q: An IQ test is designed so that the mean is 100 and the standard deviation is 16 for the population…
A:
Q: 14.4 THE STARTING SALARY CASE StartSal The chairman of the marketing department at a large state…
A: Given, The chairman of the marketing department at a large state university undertakes a stdy to…
Q: Data on 4500 college graduates show that the mean time required to graduate with a bachelor's degree…
A: Given data: n = 4500 Mean(x-bar) = 6.35 years Standard deviation =1.73 years Confidence level = 95%
Q: Per the following graph, explain the reason for every statistic that is calculated. For…
A: For patients in ICU Mean=28.2 Median=28.2 Mode: 48.3, 8.1 The average number of patients in ICU per…
Q: 2. a. It is known that 4% of the screws produced by a company weigh less than their specified value,…
A:
Q: C. Simplity 9. Which of the following is the range of the correlation coefficient (r)? C. -1 <r < 1…
A: (19) We have given that, We have to check the range of correlation coefficient (r) = ? Note:…
Q: Please help me, need answer ASAP! Industry records indicate that 60% of all computers purchased by…
A:
Q: According to the National Institutes of Health, 55% of adults experience some form of lactose…
A:
Q: The percentage of physicians who are women is 32%. In a survey of physicians employed by a large…
A: a. Consider that p is the true proportion of women physicians at the university health system.
Q: Below is a scatterplot of the number of home runs versus the number of stolen bases for major league…
A: The scatterplot shows the number of home runs versus the number of stolen bases for major league…
Q: Let {1,2,3,4,5,6}. Construct the minimal field containing set A. 1. A={{1,2}, {3,4}}
A: Given: Let, Ω={1,2,3,4,5,6} A={{1,2},{3,4}}
Q: If the maximum error with 0.99 probability is 0.25 and a sample size 400, then the standard…
A: It is given that Maximum error, E = 0.25 Sample size = 400
Q: Construct a word problem guided by the table below (week in hours and body mass index (BMI)…
A: Correlation is a method of statistical analysis and it widely used in analysis. Correlation measures…
Q: The Department of Health plans to test the lead level in a specific park. Because a high lead level…
A: To find: 1. Null hypothesis 2. Alternative hypothesis 3. Type I error
Q: Test 1: Multiple Linear Regression. Given the following data: y X₁ X₂ X3 X4 X5 8.0 19.6 94.9 2.3 5.2…
A: Since we only answer up to 3 sub-parts, we’ll answer the first 3. Please resubmit the question and…
Q: Directions: Using the given values/parts of the test of hypothesis involving population, construct…
A: 1) Given: Significance level α=0.05 Null Hypothesis H0:p=0.6 Alternative Hypothesis Ha:p≠0.6 Topic:…
Q: In a random sample of 60 workers the average time taken by them to get to work is 33.8 minutes with…
A: Given that n =60 , x bar = 33.8 ,s.d = 6.1,mu = 32.6 Alpha =0.025
Q: The confidence level is denoted by alpha or a refers to the degree of significance in which we…
A: There are two types of hypotheses of the test: Null hypothesis and Alternative Hypothesis. The null…
Q: A sample is selected from a normal population, and resulting data are as follows: 45.2, 51.5, 49.4,…
A: Given: Sample size n = 6 Significance level α = 0.05 Formula Used: Test-statistic t = X-μSn
Q: first class.
A: Step 1: Using the lower limit as 30 and a width of 10, make the classes.
Q: STATISTICS AND PROBABILITY (Answer only. NO long explanation needed. Rate will be given) TRUE OR…
A: Given that. X~N( 0 , 1 ) μ=0 , ?=1 (for standard normal distribution) Z-score =( x - μ )/?
Q: A newspaper sports reporter has a 58% accuracy for predicting the winners in NHL hockey games. A…
A: Given that A newspaper sports reporter has a 58% accuracy for predicting the winners in NHL hockey…
Q: Consider the following sample observations on stabilized viscosity of asphalt specimens. 2,797 2,907…
A: From the provided information, Sample size (n) = 5 Level of significance (α) = 0.05
Q: Find the multiple regression model of the given data: A y B с D E F 8.0 19.6 94.9 5.2 2.3 2.1 29.6…
A: Solution: From the given information,
Q: Suppose you have a Simple population regression function describe as follows Y₁ = Bo + B₁X₁ + εi…
A: Solution: From the given information, the regression equation with estimated coefficients is
Q: If the probability of rain tomorrow is 65%, what is the probability that it will not rain tomorrow?
A: Consider an event A.
Q: Calculate the z score where x = 15, µ = 1, and σ = 5
A:
Q: Find E[X-E[X]]]
A:
Q: b. A quality study was performed on the manufacture of integrated circuits. A sample of 1200 units…
A:
Q: You want to analyze the travel-to-work time for Daly City residents. Suppose that a preliminary…
A: The following information has been given: The population standard deviation is σ=10 The sample size…
Q: A. Since the cornputed value is greater than the tabular value Mr. Motas rejects the null…
A: As we are entitled to solve one question at a time I will answer 37th one as some information is…
Q: A sample is selected from a normal population, and resulting data are as follows: 45.2, 51.5, 49.4,…
A: According to policy we supposed to answer only first three part kindly repost for remaining.
Q: Which set of data would probably show a strong negative linear correlation? a) resale values of…
A: The correlation coefficient is mainly computed to know the type of relationship that lies between…
Q: The local coffee shop keeps track of how much coffee they sell versus the temperature on that day,…
A: Given data: Sales in Php 1755 1889 1514 1438 1339 1028 Temp 20.6 22.4 24.8 27.4 28.5 31.6
Q: a) Determine the value of '***'? (b) Explain what is meant by samplingistribution of the mean in…
A: Since you have posted a question with multiple sub-parts, we will solve first 3 sub-parts for you.…
Q: What is the mode of data? What is the range of data?
A: Given that Frequency data of time taken to complete laps in minutes. In this freq. data 5th no. of…
Q: If two group means are in the same homogeneous group, they are unlikely to be significantly…
A: The objective is to state whether the statement is true or false.

Step by step
Solved in 2 steps with 2 images

- Let X and Y be discrete random variables with joint pdf f(x,y) given by the following table: y = 1 y = 2 y = 3 x = 1 0.1 0.2 0 x = 2 0 0.167 0.4 x = 3 0.067 0.022 0.033 Find the marginal pdf’s of X and Y. Are X and Y independent?Let random variables X and Y have the joint pdf fX,Y (x, y) = 4xy, 0 < x < 1, 0 < y < 1 0, otherwise Find the joint pdf of U = X^2 and V = XY.Let X1, .... Xn be a random sample from a population with location pdf f(x-Q). Show that the order statistics, T(X1, ...., Xn) = (X(1), ... X(n)) are a sufficient statistics for Q and no further reduction is possible?
- Q4) If X is a continuous random variable having pdf ke~ (2x+3y) x>0y>0 xy) = = e p(x) { 0 otherwise Find a) the constant k b) P(X>1) ¢) X, X2, 02, standard deviation.Let a random variable X has the CDF as;Fx(x) = 1 ; x ≥ 1 1/2+x ; 0 ≤ x < 1 0 ; x < 0 Verify that Fx(x) is a CDF. Also- (i) find the PDF of X (ii) Calculate E[ex ] (iii) Determine the probability P[X = 0|X ≤ 0.5]Let X1 and X2 be two independent random variables. Suppose each Xi is exponentially distributed with parameter λi. Let Y=Min (X1, X2). A) Find the pdf of Y. B) Find E(Y). Hint: Let Y = Min (X1, X2). 1. P[Y > c] = P[Min (X1, X2) > c] = P[X1 > c, X2 > c] 2. Obtain the pdf of Y by differentiating its cdf of Y.
- Consider X and Y are joint distributed with PDFf(x,y)=x+y, 0≤x≤1, 0≤y≤1. (a) Find the probability that X > 0.5. (b)FindP(X> Y 1/2).(c) Are X and Y independent?Let X1, X2 denote two independent variables, each with a x^2(2) distribution. Find the joint pdf of Y1=X1 and Y2 = X2+X1. Note that the support of Y1, Y2 is 0<y1<y2<infinity. Also, find the marginal pdf of wach Y1 and Y2. Are Y1 and Y2 independent?