Per the following graph, explain the reason for every statistic that is calculated. For example, You have a scatter plot of an hourly wages vs level of education, the trend is represented by a cubic curve with R^2=0.999. It can mean that the relationship of the level of education vs the hourly wages has a cubic trend as the cubic model suits well the set of data (R^2 is very close to 1).
Per the following graph, explain the reason for every statistic that is calculated. For example, You have a scatter plot of an hourly wages vs level of education, the trend is represented by a cubic curve with R^2=0.999. It can mean that the relationship of the level of education vs the hourly wages has a cubic trend as the cubic model suits well the set of data (R^2 is very close to 1).

MATLAB: An Introduction with Applications
6th Edition
ISBN:9781119256830
Author:Amos Gilat
Publisher:Amos Gilat
Chapter1: Starting With Matlab
Section: Chapter Questions
Problem 1P

Related questions
Question
Data Management - Statistical Anaylsis
Per the following graph, explain the reason for every statistic that is calculated.
For example, You have a
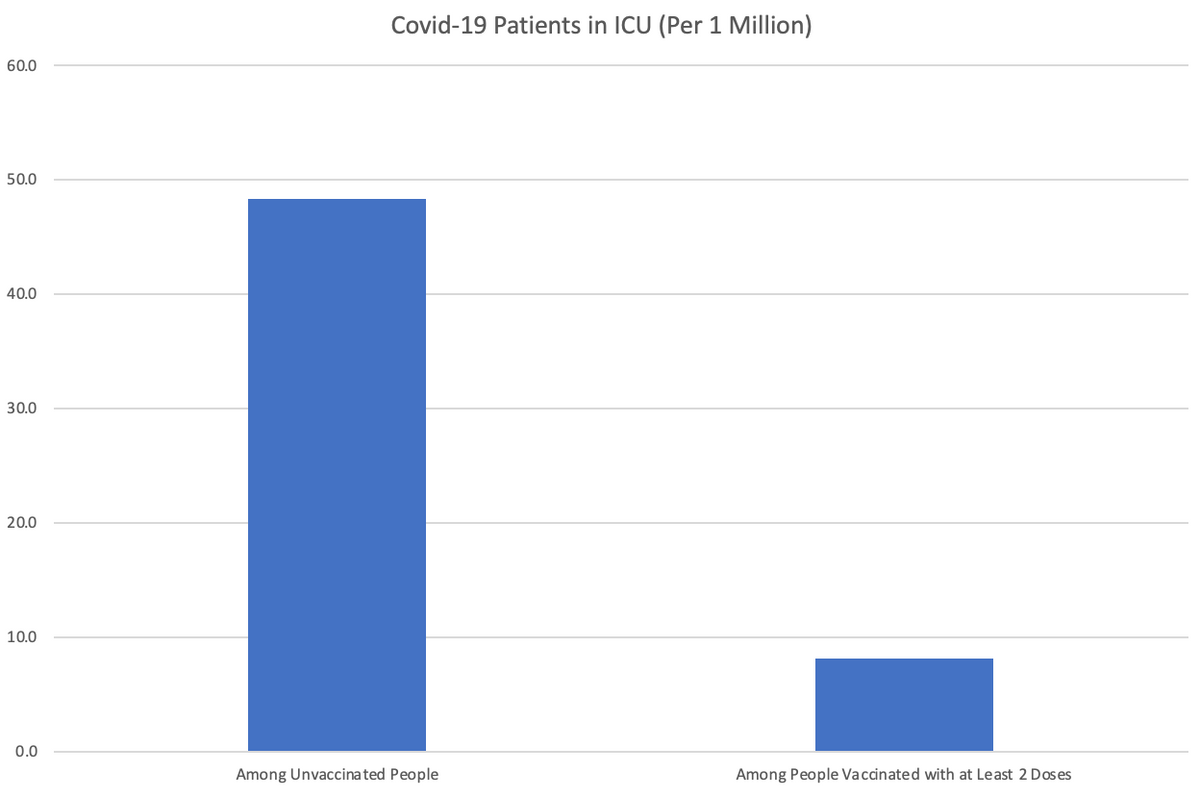
Transcribed Image Text:60.0
50.0
40.0
30.0
20.0
10.0
0.0
Covid-19 Patients in ICU (Per 1 Million)
Among Unvaccinated People
Among People Vaccinated with at Least 2 Doses
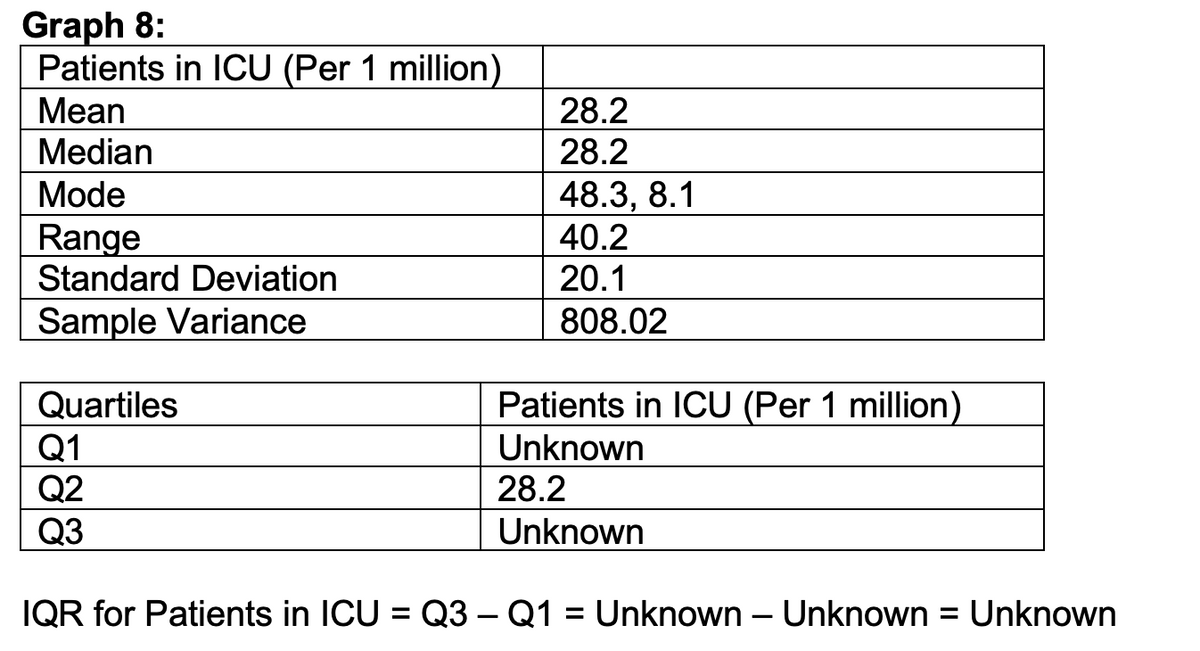
Transcribed Image Text:Graph 8:
Patients in ICU (Per 1 million)
Mean
28.2
Median
28.2
Mode
48.3, 8.1
Range
40.2
20.1
Standard Deviation
Sample Variance
808.02
Quartiles
Patients in ICU (Per 1 million)
Unknown
Q1
Q2
28.2
Q3
Unknown
IQR for Patients in ICU = Q3 – Q1 = Unknown - Unknown = Unknown
Expert Solution
This question has been solved!
Explore an expertly crafted, step-by-step solution for a thorough understanding of key concepts.

Step by step
Solved in 2 steps

Recommended textbooks for you
MATLAB: An Introduction with Applications
Statistics
ISBN:
9781119256830
Author:
Amos Gilat
Publisher:
John Wiley & Sons Inc

Probability and Statistics for Engineering and th…
Statistics
ISBN:
9781305251809
Author:
Jay L. Devore
Publisher:
Cengage Learning

Statistics for The Behavioral Sciences (MindTap C…
Statistics
ISBN:
9781305504912
Author:
Frederick J Gravetter, Larry B. Wallnau
Publisher:
Cengage Learning
MATLAB: An Introduction with Applications
Statistics
ISBN:
9781119256830
Author:
Amos Gilat
Publisher:
John Wiley & Sons Inc
Probability and Statistics for Engineering and th…
Statistics
ISBN:
9781305251809
Author:
Jay L. Devore
Publisher:
Cengage Learning
Statistics for The Behavioral Sciences (MindTap C…
Statistics
ISBN:
9781305504912
Author:
Frederick J Gravetter, Larry B. Wallnau
Publisher:
Cengage Learning

Elementary Statistics: Picturing the World (7th E…
Statistics
ISBN:
9780134683416
Author:
Ron Larson, Betsy Farber
Publisher:
PEARSON

The Basic Practice of Statistics
Statistics
ISBN:
9781319042578
Author:
David S. Moore, William I. Notz, Michael A. Fligner
Publisher:
W. H. Freeman

Introduction to the Practice of Statistics
Statistics
ISBN:
9781319013387
Author:
David S. Moore, George P. McCabe, Bruce A. Craig
Publisher:
W. H. Freeman