(1) Let (B₁) be a Brownian motion started at 0. Show that the process Xt = Bt+1 − B₁ for t≥ 0, is a Brownian motion. Hint: check the definition.
(1) Let (B₁) be a Brownian motion started at 0. Show that the process Xt = Bt+1 − B₁ for t≥ 0, is a Brownian motion. Hint: check the definition.

Linear Algebra: A Modern Introduction
4th Edition
ISBN:9781285463247
Author:David Poole
Publisher:David Poole
Chapter4: Eigenvalues And Eigenvectors
Section4.6: Applications And The Perron-frobenius Theorem
Problem 70EQ

Related questions
Question
1 only.
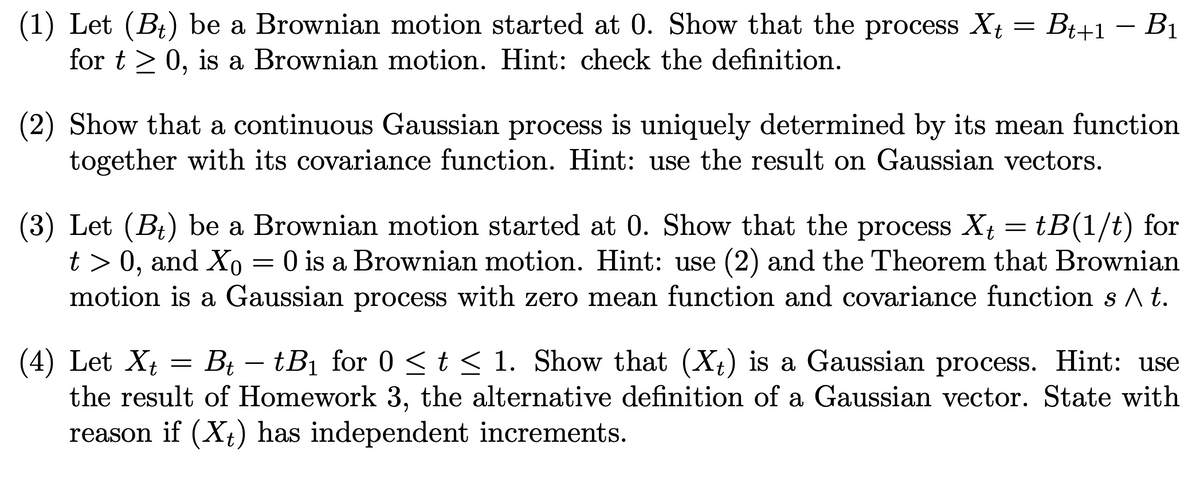
Transcribed Image Text:(1) Let (B₁) be a Brownian motion started at 0. Show that the process Xt = Bt+1 − B₁
for t≥ 0, is a Brownian motion. Hint: check the definition.
(2) Show that a continuous Gaussian process is uniquely determined by its mean function
together with its covariance function. Hint: use the result on Gaussian vectors.
(3) Let (B₁) be a Brownian motion started at 0. Show that the process X₁ = tB(1/t) for
Xt
t> 0, and Xo 0 is a Brownian motion. Hint: use (2) and the Theorem that Brownian
motion is a Gaussian process with zero mean function and covariance function s ^ t.
=
(4) Let Xt = Bt - tB₁ for 0 ≤ t ≤ 1. Show that (Xt) is a Gaussian process. Hint: use
the result of Homework 3, the alternative definition of a Gaussian vector. State with
reason if (Xt) has independent increments.
Expert Solution
This question has been solved!
Explore an expertly crafted, step-by-step solution for a thorough understanding of key concepts.

Step by step
Solved in 2 steps

Recommended textbooks for you
Linear Algebra: A Modern Introduction
Algebra
ISBN:
9781285463247
Author:
David Poole
Publisher:
Cengage Learning
Linear Algebra: A Modern Introduction
Algebra
ISBN:
9781285463247
Author:
David Poole
Publisher:
Cengage Learning