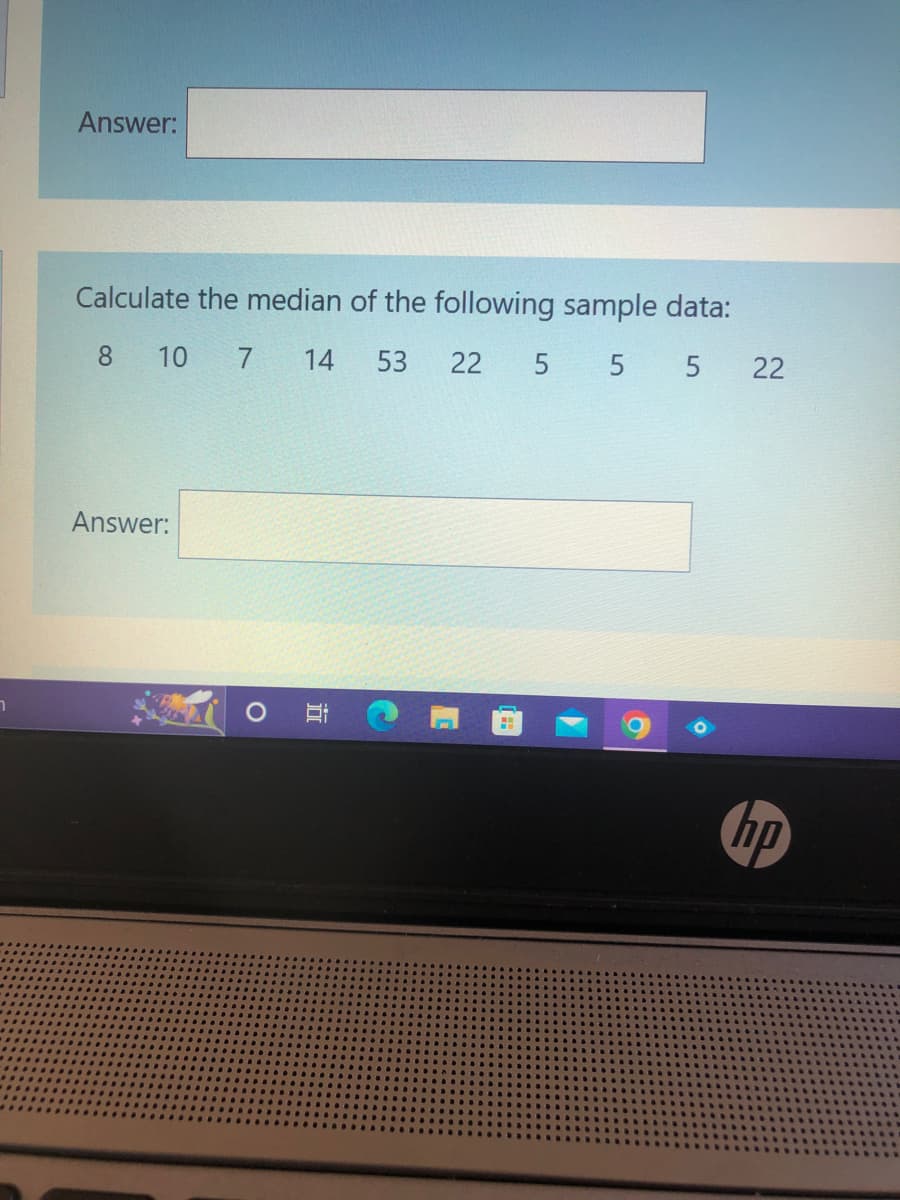
Calculate the median of the following sample data: 8 10 7 14 53 22 5 5 5 22 Answer:


Q: (a) State the null hypothesis Ho and the alternative hypothesis H₁. H :O 0 H₁ :0 (b) Determine the…
A: Given that n = 17 Sample mean = x̄ = 8.02 Sample standard deviation = s = 0.18 Population mean = μ…
Q: following is not a stationary time series model, where Y, are i.i.d N(0,02) random variables and are…
A:
Q: Test the claim that the proportion of people who own cats is significantly different than 50% at the…
A: Givensignificance level(α)=0.1sample size(n)=300sample proportion(p^)=0.49
Q: Four typists take 15,10,6 and 5 minutes respectively to type a letter. Determine the average time…
A: The time required to type a letter by four typists is given as: 15 minutes, 10 minutes, 6 minutes, 5…
Q: Two samples are taken with the following sample means, sizes, and standard deviations ¯x¯1 = 30…
A: given data X¯1 = 30 X2¯ = 32 n1 = 49 n2 = 70 s1 = 2 s2 = 4
Q: Calculate the average and standard deviations. Use Equation (6).
A: here we have to find the average and standard deviations from given data n=6
Q: A regression was run to determine if there is a relationship between hours of TV watched per day (x)…
A: Given data X= tv watched hours per day Y = no. Of situps person can do Regression equation y =…
Q: ou intend to conduct a test of homogeneity for a contingency table with 4 categories in the column…
A: given data contingency table 4 categories in column 6 categories in row sample size n = 434 df for…
Q: A population has a mean of 53 and a standard deviation of 21. A sample of 81 observations will be…
A: Continuous Probability Distribution When normality is included in the research of a big sample…
Q: Suppose the newspaper states that the probability of rain today is 40%. What is the complement of…
A: given data probability of rain today = 40% in symbol : p(rain today) = 0.40
Q: Use the Student_Data which consists of 200 MBA students at Whatsamattu U. It includes variables…
A: The given data is entered in excel from Column A to I and row 1 to 101 as shown below ID Gender…
Q: In a medium-sized city, the chamber of commerce often holds fundraisers. It has been studying the…
A: Introduction: It is required to obtain the residual for the attendance, based on the given…
Q: explain how you could tell by looking at a boxplot where the tallest bars onthe histogram would be…
A: A boxplot is a graph which is plotted using the quartiles and median of the dataset, while median is…
Q: A. Find the standard deviation: (round your answer to two decimal places.) Standard deviation…
A: From given data we have : 30 students who live off campus. 720, 720, 720, 920, 690, 560, 680, 1020,…
Q: 1. Using a data set with 4 predictor variable data set, an analyst decided to use regression as…
A: Given: There are 4 predictor variables. The regression line is Y^=b0+b1X1+b2X2+b3X3+b4X4+b5X5
Q: What are their accuracies and precisions? Why don't my SigFigs match?
A: We have three dispensers each having a volume of 296 ml. The Actual volume is 296 ml.
Q: The following three independent random samples are obtained from three normally distributed…
A: Given data: Group1: Internship Group2: Co-op Group3: Work study 11.5 9.25 17.5 10.75 14.5…
Q: A consumer advocacy group is doing a large study on car rental practices. Among other things, the…
A: Sample is the subset of population. For the larger population, the margin of error is known then…
Q: Lifetimes of AAA batteries are approximately normally distributed. A manufacturer wants to estimate…
A: Given: Sample size n=25 Sample mean = 9.9 hour Sample standard deviations s=1.9 To find 99%…
Q: 2 3 4 y 5.8 4.4 4.3 3.5 X 1 5 6 3.4 2.6
A: The given bivariate data set is:
Q: Demand for stereo headphones and MP3 players for joggers has caused Nina Industries to grow almost…
A: Given data: This year MONTH(x) DEMAND (y) January 1 4115 February 2 4215 March 3 3915…
Q: It takes an average of 10.9 minutes for blood to begin clotting after an injury. An EMT wants to see…
A: given data,n=63x = 11.3s=1.39α=0.01claim :μ >10.9we have to complete hypothesis testing for…
Q: Analysis of variance compares the means of a response variable for several groups. ANOVA compares…
A:
Q: Example 5: Find a 90% confidence interval for the mean difference in the mileage obtained for tires…
A: Given: 50 45 50 50 100 100 100 -10 75 -25 0 25 75 25 50 40 35
Q: If n=31, ¯xx¯(x-bar)=38, and s=16, construct a confidence interval at a 98% confidence level. Assume…
A: given data n = 31 x¯ =38 s=16 normal distribution 98% ci for μ= ? α=1-0.98=0.02 Df = n-1 = 30
Q: On their website, a property management company states that the mean monthly rent for apartments on…
A: In the given scenario, we need to perform a suitable hypothesis test for the given scenario. The…
Q: The mayor is interested in finding a 90% confidence interval for the mean number of pounds of trash…
A: Givenconfidence level=90%sample size(n)=234Mean(x)=34.5standard deviation(s)=7.7
Q: Use the Student_Data which consists of 200 MBA students at Whatsamattu U. It includes variables…
A: Given data of 100 MBA male Students 101 0 No Major Unemployed 53 3.01 3.15 6 0 102 0…
Q: You wish to test the following claim (H) at a significance level of a = 0.001. For the context of…
A: Here we have to used A paired t-test when we are interested in the difference between two variables…
Q: A randomsample of 62 observations with a mean of 117 anda population variance of 98,determine the…
A: From the provided information, Sample size (n) = 62 Population variance (σ2) = 98 Sample mean (x̄) =…
Q: Problem Let X be a discrete random variable with range {1, 2, 3, ...}, distribution function P(X =…
A:
Q: QUESTION 17 Calculate the weighted mean for sample 1 and sample 2. Sample 1 has 14 scores with a…
A: It is given that For sample 1, sample size n1 = 14, sample mean = M1 = 28.20 For sample 2, sample…
Q: You wish to test the following claim (H₁) at a significance level of a = 0.001. H₂:₁ = ₂ Ha: <H₂ You…
A: Given: H0:μ1=μ2 Ha:μ1<μ2 (claim) Required: To test the claim at a significance level α=0.001
Q: According to a newspaper, customers are not settling for automobiles straight off the production…
A: Confidence interval is used to measure the range where the true population parameter can likely to…
Q: (e) State the null and alternative hypotheses for an analysis of variance F-test. O Ho: One or more…
A: to solve last 3 sub part (e,f,conclusion) have to complete ANOVA table first
Q: QUESTION 50 "An ANOVA is used to evaluate the differences among 2 treatment conditions with a sample…
A: It is given that Number of treatments k = 2 Number of observations in each condition n = 14
Q: Listed below are the amounts (dollars) it costs for marriage proposal packages at different…
A: x x2 40 1600 50 2500 50 2500 55 3025 60 3600 75 5625 90…
Q: You are conducting a test of the claim that the row variable and the column variable are dependent…
A: The provided row and column variables are given as:
Q: The following is a set of data for a population with N = 10. 15 2 1 3 10 9 9 10 9 8 a. Compute the…
A: Given data 15,2,1,3,10,9,9,10,9,8
Q: The average effect size in social psychology is around d = 0.21. Conventionally, a sample over 30…
A: The provided information is as follows: d=0.21n1=30n2=30 Consider the significance level α=0.05.
Q: Find the following t-values in Table 4 of Appendix I or using SALT. (Round your answers to three…
A: As per company guidelines I solved first three subparts of this question .
Q: A simple random sample of 8 employees of a corporation provided the following information. Employee…
A: A simple random sample of 8 employees of a corporation provided the given Information. The objective…
Q: question 26 a repeated measures ANOVA using 11 participants observed a df within = 30 and ss-error=…
A:
Q: The smallest numeric value in a data set subtracted from the largest is the: a. variance. O b.…
A: We have to find the term which is the difference between the largest value and the smallest value.
Q: How many different samples of size 3 (without replacement) can be taken from a finite population of…
A: Given: Population size N = 10 Sample size n = 3 Formula Used: Simple random sampling (Without…
Q: You are conducting a multinomial hypothesis test (αα = 0.05) for the claim that all 5 categories are…
A: From the given information, the total number of observed frequencies is 74. Here, all 5 categories…
Q: a. Compute the population mean. b. Compute the population standard deviation.
A: Given: Set of data x: 15,2,1,3,10,9,9,10,9,8 To find population mean and population standard…
Q: Consider the following. (a) Draw a tree diagram to display all the possible head-tail sequences that…
A:
Q: A survey question asks respondents to record the exact amount of money that they spent on…
A: Here we have to identify the correct option from given statement
Q: Example 5: Find a 90% confidence interval for the mean difference in the mileage obtained for tires…
A: Given: 50 45 50 50 100 100 100 -10 75 -25 0 25 75 25 50 40 35…


Trending now
This is a popular solution!

Step by step
Solved in 2 steps


