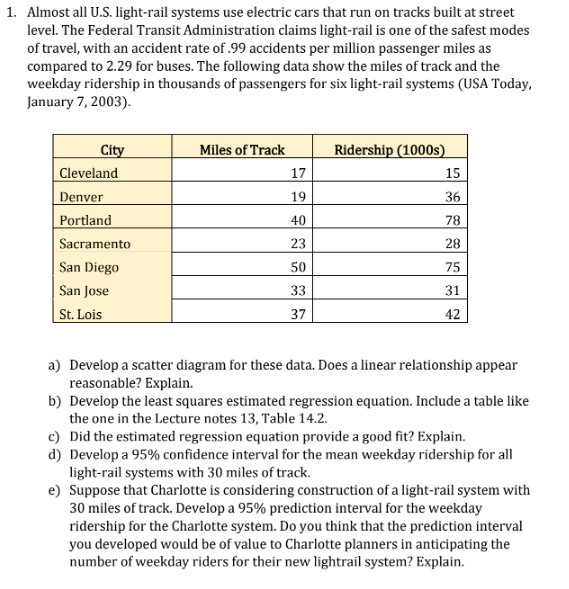
1. Almost all U.S. light-rail systems use electric cars that run on tracks built at street level. The Federal Transit Administration claims light-rail is one of the safest modes of travel, with an accident rate of .99 accidents per million passenger miles as compared to 2.29 for buses. The following data show the miles of track and the weekday ridership in thousands of passengers for six light-rail systems (USA Today, January 7, 2003). Miles of Track Ridership (1000s) City Cleveland Denver Portland Sacramento | San Diego San Jose |St. Lois 17 15 19 36 40 78 23 28 50 75 33 31 37 42 a) Develop a scatter diagram for these data. Does a linear relationship appear reasonable? Explain. b) Develop the least squares estimated regression equation. Include a table like the one in the Lecture notes 13, Table 14.2. c) Did the estimated regression equation provide a good fit? Explain. d) Develop a 95% confidence interval for the mean weekday ridership for all light-rail systems with 30 miles of track. e) Suppose that Charlotte is considering construction of a light-rail system with 30 miles of track. Develop a 95% prediction interval for the weekday ridership for the Charlotte system. Do you think that the prediction interval you developed would be of value to Charlotte planners in anticipating the number of weekday riders for their new lightrail system? Explain.
1. Almost all U.S. light-rail systems use electric cars that run on tracks built at street level. The Federal Transit Administration claims light-rail is one of the safest modes of travel, with an accident rate of .99 accidents per million passenger miles as compared to 2.29 for buses. The following data show the miles of track and the weekday ridership in thousands of passengers for six light-rail systems (USA Today, January 7, 2003). Miles of Track Ridership (1000s) City Cleveland Denver Portland Sacramento | San Diego San Jose |St. Lois 17 15 19 36 40 78 23 28 50 75 33 31 37 42 a) Develop a scatter diagram for these data. Does a linear relationship appear reasonable? Explain. b) Develop the least squares estimated regression equation. Include a table like the one in the Lecture notes 13, Table 14.2. c) Did the estimated regression equation provide a good fit? Explain. d) Develop a 95% confidence interval for the mean weekday ridership for all light-rail systems with 30 miles of track. e) Suppose that Charlotte is considering construction of a light-rail system with 30 miles of track. Develop a 95% prediction interval for the weekday ridership for the Charlotte system. Do you think that the prediction interval you developed would be of value to Charlotte planners in anticipating the number of weekday riders for their new lightrail system? Explain.

Functions and Change: A Modeling Approach to College Algebra (MindTap Course List)
6th Edition
ISBN:9781337111348
Author:Bruce Crauder, Benny Evans, Alan Noell
Publisher:Bruce Crauder, Benny Evans, Alan Noell
Chapter5: A Survey Of Other Common Functions
Section5.3: Modeling Data With Power Functions
Problem 6E: Urban Travel Times Population of cities and driving times are related, as shown in the accompanying...

Related questions
Topic Video
Question
just d and e options calculate. please dont use excel. calculate to paper with detail .
Transcribed Image Text:1. Almost all U.S. light-rail systems use electric cars that run on tracks built at street
level. The Federal Transit Administration claims light-rail is one of the safest modes
of travel, with an accident rate of .99 accidents per million passenger miles as
compared to 2.29 for buses. The following data show the miles of track and the
weekday ridership in thousands of passengers for six light-rail systems (USA Today,
January 7, 2003).
City
Miles of Track
Ridership (1000s)
| Cleveland
17
15
Denver
19
36
Portland
40
78
Sacramento
23
28
San Diego
| San Jose
St. Lois
50
75
33
31
37
42
a) Develop a scatter diagram for these data. Does a linear relationship appear
reasonable? Explain.
b) Develop the least squares estimated regression equation. Include a table like
the one in the Lecture notes 13, Table 14.2.
c) Did the estimated regression equation provide a good fit? Explain.
d) Develop a 95% confidence interval for the mean weekday ridership for all
light-rail systems with 30 miles of track.
e) Suppose that Charlotte is considering construction of a light-rail system with
30 miles of track. Develop a 95% prediction interval for the weekday
ridership for the Charlotte system. Do you think that the prediction interval
you developed would be of value to Charlotte planners in anticipating the
number of weekday riders for their new lightrail system? Explain.
Expert Solution
This question has been solved!
Explore an expertly crafted, step-by-step solution for a thorough understanding of key concepts.

Step by step
Solved in 2 steps

Knowledge Booster


Learn more about
Need a deep-dive on the concept behind this application? Look no further. Learn more about this topic, statistics and related others by exploring similar questions and additional content below.Recommended textbooks for you
Functions and Change: A Modeling Approach to Coll…
Algebra
ISBN:
9781337111348
Author:
Bruce Crauder, Benny Evans, Alan Noell
Publisher:
Cengage Learning

Glencoe Algebra 1, Student Edition, 9780079039897…
Algebra
ISBN:
9780079039897
Author:
Carter
Publisher:
McGraw Hill
Functions and Change: A Modeling Approach to Coll…
Algebra
ISBN:
9781337111348
Author:
Bruce Crauder, Benny Evans, Alan Noell
Publisher:
Cengage Learning
Glencoe Algebra 1, Student Edition, 9780079039897…
Algebra
ISBN:
9780079039897
Author:
Carter
Publisher:
McGraw Hill