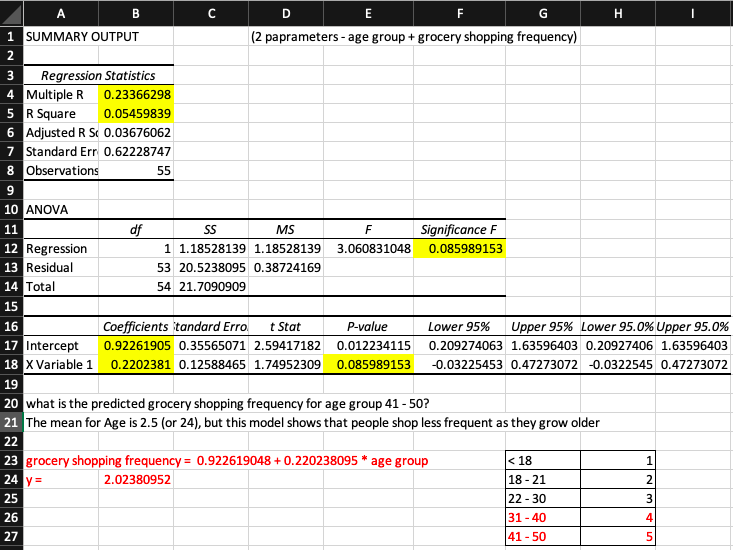
1 SUMMARY OUTPUT (2 paprameters - age group + grocery shopping frequency) 2 Regression Statistics 4 Multiple R 0.23366298 5 R Square 6 Adjusted R S 0.03676062 7 Standard Err 0.62228747 8 Observations 3 0.05459839 55 9 10 ANOVA Significance F df 1 1.18528139 1.18528139 11 SS MS F 12 Regression 13 Residual 14 Total 3.060831048 0.085989153 53 20.5238095 0.38724169 54 21.7090909 15 Coefficients tandard Erro t Stat P-value 16 Lower 95% Upper 95% Lower 95.0% Upper 95.0% 17 Intercept 18 X Variable 1 0.2202381 0.12588465 1.74952309 0.085989153 0.92261905 0.35565071 2.59417182 0.012234115 0.209274063 1.63596403 0.20927406 1.63596403 -0.03225453 0.47273072 -0.0322545 0.47273072 19 20 what is the predicted grocery shopping frequency for age group 41 - 50? 21 The mean for Age is 2.5 (or 24), but this model shows that people shop less frequent as they grow older 22 23 grocery shopping frequency = 0.922619048 + 0.220238095 * age group 24 y= < 18 1 18 - 21 22 - 30 31- 40 2.02380952 2 25 3 26 4. 27 41-50


Correlation
Correlation defines a relationship between two independent variables. It tells the degree to which variables move in relation to each other. When two sets of data are related to each other, there is a correlation between them.
Linear Correlation
A correlation is used to determine the relationships between numerical and categorical variables. In other words, it is an indicator of how things are connected to one another. The correlation analysis is the study of how variables are related.
Regression Analysis
Regression analysis is a statistical method in which it estimates the relationship between a dependent variable and one or more independent variable. In simple terms dependent variable is called as outcome variable and independent variable is called as predictors. Regression analysis is one of the methods to find the trends in data. The independent variable used in Regression analysis is named Predictor variable. It offers data of an associated dependent variable regarding a particular outcome.


Trending now
This is a popular solution!

Step by step
Solved in 2 steps with 2 images


