1 
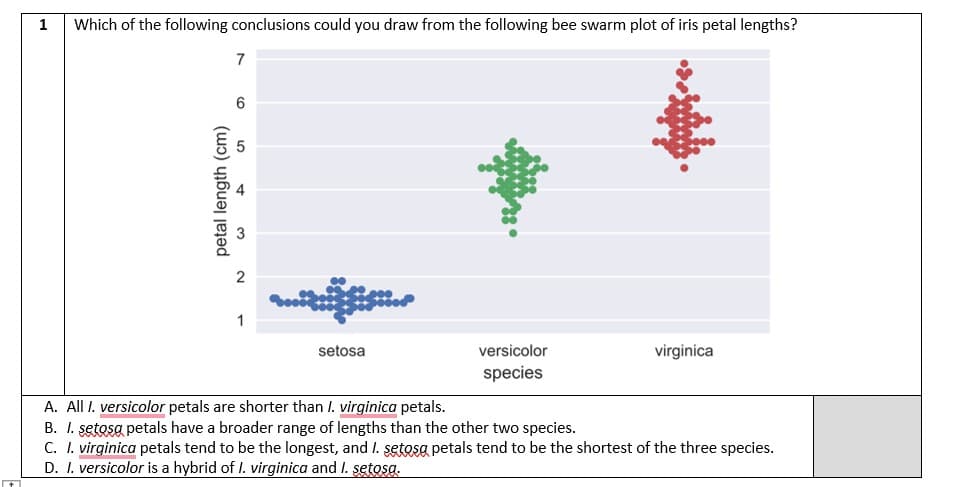
Which of the following conclusions could you draw from the following bee swarm plot of iris petal lengths? petal length (cm) 7 10 st 2 1 Boo setosa versicolor species virginica A. All I. versicolor petals are shorter than I. virginica petals. B. I. setosg petals have a broader range of lengths than the other two species. C. I. virginica petals tend to be the longest, and I. setosa petals tend to be the shortest of the three species. D. I. versicolor is a hybrid of I. virginica and I. setosa.
Q: ic model for the data?
A: hrs vehicles 9 A.M 6.2 11 A.M 7.4 1 P.M 7.5 3 P.M 6.6 5 P.M 3.9 The quadratic…
Q: Determine whether the following graph can represent a variable with a normal distribution. Explain…
A: Given:
Q: u increase the confidence level, what do you expect will be true ut the new confidence interval?…
A: Explanation:- If we increase the confidence level the margin of error also increases.
Q: three confidence intervals, all from the same random sample. The confidence leve 5%, and 99%. The…
A: Given all from the same random sample. The confidence levels are 90%, 95%, and 99%. The confidence…
Q: An Internet provider contacts a random sample of 300 customers and asks how many hours per week the…
A:
Q: In a survey of a group of men, the heights in the 20-29 age group were normally distributed, with a…
A:
Q: Find the standard deviation, s, of sample data summarized in the frequency distribution table below…
A:
Q: Test the claim that the proportion of men who own cats is significantly different than 20% at the…
A:
Q: 2. Suppose that Yt follows the stationary AR (1) model Yt=2.5+0.7Yt−1+ϵt, where…
A: The Given stationary AR(1) model yt=2.5+0.7yt-1.
Q: You measure 43 backpacks' weights, and find they have a mean weight of 69 ounces. Assume the…
A: Use the Z-distribution to construct the 99 % confidence interval for population mean The provided…
Q: A random sample of 149 full-grown lobsters had a mean weight of 15 ounces. Assume that population…
A:
Q: In a survey of 3908 adults, 718 oppose allowing transgender students to use the bathrooms of the…
A: We have to find confidence interval for population proportion . Formula : CI = p^ ±…
Q: A distribution and the observed frequencies of the values of a variable from a simple random sample…
A: Given data is as follows: Distribution Observed Frequency, O 0.1875 20 0.25 21…
Q: You find out that the average 10th grade math score, for Section 6 of the local high school, is 87…
A:
Q: A medical study followed a sample of 14 heart patients who had received electronic pacemakers. The…
A:
Q: Use the following cell phone airport data speeds (Mbps) from a particular network. Find the…
A: Given:
Q: Assume that a sample is used to estimate a population mean μμ. Find the margin of error M.E. that…
A:
Q: A population is normally distributed with µ = 90 and σ = 8. For this population, which is the 29th…
A: Solution-: Given: μ=90,σ=8 We want to find 29th percentile?
Q: In each of parts (a)-(c), we have given a likely range for the observed value of a sample proportion…
A: Hi! Thank you for the question, As per the honor code, we are allowed to answer three sub-parts at a…
Q: You are given the sample mean and the population standard deviation. Use this information to…
A:
Q: Use the Central Limit Theorem to find the mean and standard error of the mean of the sampling…
A: The mean is 222 and the standard deviation is 67.
Q: nsider the following frequency table representing the distributic morning walk with the dog (in…
A: Formula for midpoint of class frequency distribution table. Midpoint = (upper class + lower…
Q: Estimate the linear probability model using Purchase as the response variable and Age as the…
A: Linear Probability Model: A linear probability model is a special case of a binary regression model…
Q: The following MINITAB output display presents a 98% confidence interval for the difference between…
A: From the provided information,
Q: Test H0: σ12 = σ22 vs. Ha: σ12 != σ22 at 10% significance where σ1 is the standard deviation of the…
A: Hypothesis for variance ratio test Null hypothesis: The variance ratio is equal to one OR Null…
Q: Assume the random variable x is normally distributed with mean μ = 85 and standard deviation a=4.…
A: The random variable x is normally distributed. Mean = μ = 85 Standard deviation = σ = 4
Q: You set a criterion that if you randomly sample someone with IQ that falls into the extreme 5% of…
A: Given: Mean μ=100 Standard deviation σ=15 Someone with IQ that falls into the extreme 5% of the…
Q: The distribution of heights of adult men is approximately normal with a mean of 69 inches and a…
A: Mean = 69 Standard deviation = 2 Z-score = -0.5
Q: In 2010, shortly before a country's midterm elections, people in that country were dissatisfied with…
A: Given: Population proportion(p)=61%=0.61Sample proportion(p^)=64%=0.64Sample size(n)=1042
Q: Which distribution should you use? You are approximating the proportion of the population in…
A: According to the given information in this question We need to identify the correct distribution
Q: Which distribution should you You are approximating the population mean. You know the population…
A: Provided information: Population standard deviation is given.
Q: College tuition: A simple random sample of 40 colleges and universities in the United States has a…
A: Sample size (n) = 40Sample mean (x̅) = 19200Standard deviations (s) = 10800Significance level (α) =…
Q: Step 2 of 5: Find the upper class limit of the second class.
A: Given that Histogram of the data Histogram data to class frequencies as follows Class Frequency…
Q: 2. The weight of bolts produced by a machine has standard deviation of 0.03 pounds. Assuming that…
A: Margin of error=e=0.005 , standard deviations σ=0.03
Q: margin of error = 0.025; confidence level = 95%; likely range=0.3 to 0.4 The required sample size is…
A: Given that Margin of error =E =0.025 95% confidence level.
Q: A best-fit line through the Amundsen-Scott weather station, located at the South Pole itself, has…
A: The equation of the regression line is written as: Y = a+bX Where Y = Dependent variable X =…
Q: A large candy company has a product that comes in several different colors. The company claims that…
A: Hey there! Thank you for posting the question. Since your question has more than 3 parts, we are…
Q: The average retirement age in America is 64 years old. Do small business owners retire at a…
A:
Q: he IQ of a person follows a normal distribution and has a mean of 100 and a standard deviation of…
A: Given that The data is normally distributed with Mean (μ) = 100 Standard deviation (σ) = 15 We…
Q: Following is a sample of seven matched pairs. Sample 1 25 Sample 2 21 Send data to Excel Part: 0 / 4…
A: Suppose μd is the difference of means of sample 1 and sample 2.
Q: 13. Contaminated water: The concentration of benzene was atlu291 measured in units of milligrams per…
A: From the provided information,
Q: The Army reports that the distribution of head circumferences among male soldiers is approximately…
A:
Q: More than one teacher has given the following advice: choose answer C when blindly guessing among…
A: Given:
Q: You measure 43 backpacks' weights, and find they have a mean weight of 69 ounces. Assume the…
A: It is given that the sample mean is 69 and the population standard deviation is 7.6.
Q: Tree heights: Cherry trees in a certain orchard have heights that are normally distributed with mean…
A: Given: Mean,u= 113 standard deviation σ= 11
Q: A point is generated at random in the plane according to the following polar scheme. A radius R is…
A: The Given point is generated at random in the plane. A radius R is chosen, the distribution of R2 is…
Q: Let X₁, X2, X3, X4, X5 be an independent and identically random variables following a Binomial…
A: Dear student, According to Bartleby guidelines we can answer only first 3 subparts at once. If you…
Q: For the specified margin of error and confidence level, obtain a sample size that will ensure a…
A: GivenMargin of error(E)=0.03confidence level = 99%
Q: A factorial experiment was designed to test for any significant differences in the time needed to…
A:
Q: . The average IQ of male students at State Universities in the U. S. is reported to be 111. A random…
A: Solution is given in the steps below Thanks!
Step by step
Solved in 2 steps
- Based on the parallel boxplots in the display, which of the following statements about these data sets CANNOT be justified? 1. The range of the two sets of data is the same 2. The data in set A has less variability than the data in set B 3. The median of set A is greater than the median of set B 4. The interquartile range of set B is more than twice the interquartile range of set A Set B has more data than set AMr. James, president of Daniel-James Financial Services, believes that there is a relationship between the number of client contacts and the dollar amount of sales. To document this assertion, he gathered the following information from a sample of clients for the last month. Let X represent the number of times that the client was contacted and Y represent the valye of sales ($1000) for each client sampled. Number of Contacts (X) Sales ($1000) 14 24 12 14 20 28 16 30 23 30 c) James would like to require 30 client contacts per month. Based upon the above data, predict what the monthly sales would be for this number of client contacts. What would be your advice to Mr. James about his proposed policy?The table below summarizes data from a survey of a sample of women. Using a 0.01significance level, and assuming that the sample sizes of 800 men and 300 women are predetermined, test the claim that the proportions of agree/disagree responses are the same for subjects interviewed by men and the subjects interviewed by women. Does it appear that the gender of the interviewer affected the responses of women? Gender of Interviewer Man Woman Women who agree 498 247 Women who disagree 302 53 Compute the test statistic, rounding to three decimal places. Find the critical value(s). (Round to three decimal places) What is the conclusion based on the hypothesis test?
- The business objective of the director of Game Ghana is to forecast monthly sales for all new stores, based on the number of profiled customers who live no more than 30 minutes from a Game store. To examine the relationship between the number of profiled customers who live within a fixed radius from a Game store and it monthly sales, data were collected from a sample of 10 stores:Store 1 2 3 4 5 6 7 8 9 10No of customers (‘000)5728432453 Monthly Sales (‘000)81261487910128(a) Use the least-squares method to compute the regression coefficients ? ??? ?(b) Write down the estimated equation and predict the monthly sales if there are 9000 customers(c) Determine the coefficient of determination, r2 and explain its meaning in this problem(d) Determine the value of the extent of relationship between monthly sales and number of customers, and interpret your results.Answer the following using the Boxplot attached. 1a) Which region (North or South) has the town with the largest mortality?b) Which region (North or South) has the town with the smallest mortality?c) In terms of the central tendency, which region has a higher mortality?d) Is the mortality more dispersed in the North or the South?An agent for a property management company would like to be able to predict the monthly rental cost for apartments based on the size of the apartment as defined by square footage. A sample of the rent of 25 apartments in a college rental neighborhood was selected, and the information collected revealed the following: Apartment Size (Sq. Ft.) Monthly Rent ($) 1 850 950 2 1,450 1,600 3 1,085 1,200 4 1,232 1,500 5 718 950 6 1,485 1,700 7 1,136 1,650 8 726 935 9 700 875 10 956 1,150 11 1,100 1,400 12 1,285 1,650 13 1,985 2,300 14 1,369 1,800 15 1,175 1,400 16 1,225 1,450 17 1,245 1,100 18 1,259 1,700 19 1,150 1,200 20 896 1,150 21 1,361 1,600 22 1,040 1,650 23 755 1,200 24 1,000 800 25 1,200 1,750 e) Determine the coefficient of determination r2 and then completely interpret…
- An agent for a property management company would like to be able to predict the monthly rental cost for apartments based on the size of the apartment as defined by square footage. A sample of the rent of 25 apartments in a college rental neighborhood was selected, and the information collected revealed the following: Apartment Size (Sq. Ft.) Monthly Rent ($) 1 850 950 2 1,450 1,600 3 1,085 1,200 4 1,232 1,500 5 718 950 6 1,485 1,700 7 1,136 1,650 8 726 935 9 700 875 10 956 1,150 11 1,100 1,400 12 1,285 1,650 13 1,985 2,300 14 1,369 1,800 15 1,175 1,400 16 1,225 1,450 17 1,245 1,100 18 1,259 1,700 19 1,150 1,200 20 896 1,150 21 1,361 1,600 22 1,040 1,650 23 755 1,200 24 1,000 800 25 1,200 1,750 i) Determine a 95% interval estimate for the average rent of apartments with 1000…Each student in a class has a box of Reese's pieces containing 25 candies. (The following is how many orange candies each student received in their box of 25) Orange candies: 17 15 11 7 14 13 15 11 13 7 14 A. Create a dot plot for the sample proportions of orange candies collected B. In what way would the dotplot have looked different if each student had taken a sample of 10 candiesinstead of 25? C. In what way would the dotplot have looked different if each student had taken a sample of 75candies instead of 25?