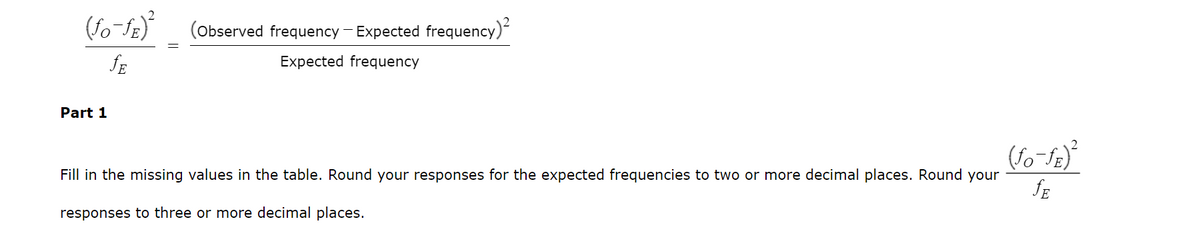
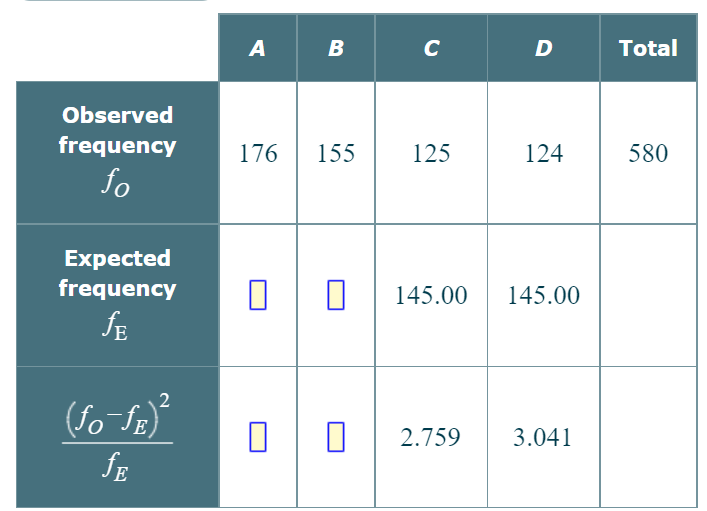
More than one teacher has given the following advice: choose answer C when blindly guessing among four answers in a multiple choice test, since C is more often the correct answer than either A, B, or D. Suppose that we take a random sample of 580 correct answers from multiple-choice tests for introductory college courses and obtain the information summarized by the first row of numbers in the table below. These numbers are the observed frequencies for the categories A, B, C, and D for our sample of 580 correct answers. The second row of numbers contains the frequencies expected for a sample of 580 correct answers if a correct answer is equally likely to be A, B, C, or D. The bottom row of numbers contains the following value for each of the correct answer categories A, B, C, and D.


More than one teacher has given the following advice: choose answer C when blindly guessing among four answers in a multiple choice test, since C is more often the correct answer than either A, B, or D. Suppose that we take a random sample of 580 correct answers from multiple-choice tests for introductory college courses and obtain the information summarized by the first row of numbers in the table below. These numbers are the observed frequencies for the categories A, B, C, and D for our sample of 580 correct answers. The second row of numbers contains the frequencies expected for a sample of 580 correct answers if a correct answer is equally likely to be A, B, C, or D. The bottom row of numbers contains the following value for each of the correct answer categories A, B, C, and D.


Trending now
This is a popular solution!

Step by step
Solved in 3 steps with 2 images
