1. A genetic experiment involving peas yielded one sample of offspring consisting of 434 green peas and 134 yellow peas. Use a 0.05 significance level to test the claim that under the same circumstances, 27% of offspring peas will be yellow. Identify the null hypothesis, alternative hypothesis, test statistic, P-value, conclusion about the null hypothesis, and final conclusion that addresses the original claim. Use the P-value method and the normal distribution as an approximation to the binomial distribution. a. What are the null and alternative hypotheses? b. What is the test statistic? c. What is the P-value? d. What is the conclusion about the null hypothesis? A. Fail to reject the null hypothesis because the P-value is less than or equal to the significance level, . B. Reject the null hypothesis because the P-value is less than or equal to the significance level,. C. Fail to reject the null hypothesis because the P-value is greater than the significance level, . D. Reject the null hypothesis because the P-value is greater than the significance level,. e. What is the final conclusion? A. There is not sufficient evidence to warrant rejection of the claim that 27% of offspring peas will be yellow. B. There is sufficient evidence to warrant rejection of the claim that 27% of offspring peas will be yellow. C. There is sufficient evidence to support the claim that than 27% of offspring peas will be yellow. D. There is not sufficient evidence to support the claim that less than 27% of offspring peas will be yellow.
1. A genetic experiment involving peas yielded one sample of offspring consisting of 434 green peas and 134 yellow peas. Use a 0.05 significance level to test the claim that under the same circumstances, 27% of offspring peas will be yellow. Identify the null hypothesis, alternative hypothesis, test statistic, P-value, conclusion about the null hypothesis, and final conclusion that addresses the original claim. Use the P-value method and the normal distribution as an approximation to the binomial distribution. a. What are the null and alternative hypotheses? b. What is the test statistic? c. What is the P-value? d. What is the conclusion about the null hypothesis? A. Fail to reject the null hypothesis because the P-value is less than or equal to the significance level, . B. Reject the null hypothesis because the P-value is less than or equal to the significance level,. C. Fail to reject the null hypothesis because the P-value is greater than the significance level, . D. Reject the null hypothesis because the P-value is greater than the significance level,. e. What is the final conclusion? A. There is not sufficient evidence to warrant rejection of the claim that 27% of offspring peas will be yellow. B. There is sufficient evidence to warrant rejection of the claim that 27% of offspring peas will be yellow. C. There is sufficient evidence to support the claim that than 27% of offspring peas will be yellow. D. There is not sufficient evidence to support the claim that less than 27% of offspring peas will be yellow.

College Algebra (MindTap Course List)
12th Edition
ISBN:9781305652231
Author:R. David Gustafson, Jeff Hughes
Publisher:R. David Gustafson, Jeff Hughes
Chapter8: Sequences, Series, And Probability
Section8.7: Probability
Problem 58E: What is meant by the sample space of an experiment?

Related questions
Question
Transcribed Image Text:Worksheet #15
Name:
Hypothesis Testing
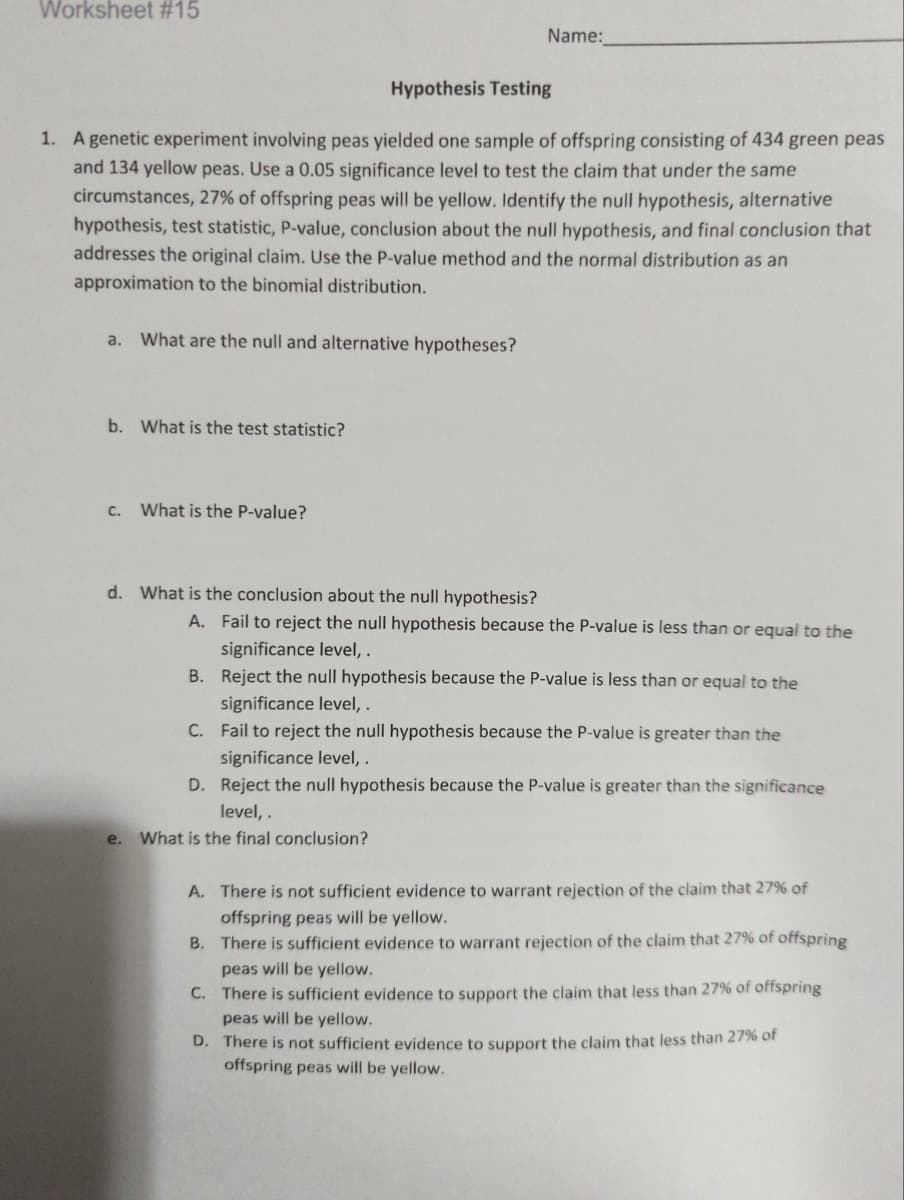
1. A genetic experiment involving peas yielded one sample of offspring consisting of 434 green peas
and 134 yellow peas. Use a 0.05 significance level to test the claim that under the same
circumstances, 27% of offspring peas will be yellow. Identify the null hypothesis, alternative
hypothesis, test statistic, P-value, conclusion about the null hypothesis, and final conclusion that
addresses the original claim. Use the P-value method and the normal distribution as an
approximation to the binomial distribution.
a. What are the null and alternative hypotheses?
b. What is the test statistic?
C.
What is the P-value?
d. What is the conclusion about the null hypothesis?
A. Fail to reject the null hypothesis because the P-value is less than or equal to the
significance level, .
B. Reject the null hypothesis because the P-value is less than or equal to the
significance level,.
C. Fail to reject the null hypothesis because the P-value is greater than the
significance level, .
D. Reject the null hypothesis because the P-value is greater than the significance
level, .
e. What is the final conclusion?
A. There is not sufficient evidence to warrant rejection of the claim that 27% of
offspring peas will be yellow.
B. There is sufficient evidence to warrant rejection of the claim that 27% of offspring
peas will be yellow.
C. There is sufficient evidence to support the claim that less than 27% of offspring
peas will be yellow.
D. There is not sufficient evidence to support the claim that less than 27% of
offspring peas will be yellow.
Expert Solution
This question has been solved!
Explore an expertly crafted, step-by-step solution for a thorough understanding of key concepts.

This is a popular solution!

Trending now
This is a popular solution!

Step by step
Solved in 2 steps with 1 images

Recommended textbooks for you
College Algebra (MindTap Course List)
Algebra
ISBN:
9781305652231
Author:
R. David Gustafson, Jeff Hughes
Publisher:
Cengage Learning

College Algebra (MindTap Course List)
Algebra
ISBN:
9781305652231
Author:
R. David Gustafson, Jeff Hughes
Publisher:
Cengage Learning