1. A random sample of 49 business establishments shows that the average monthly water consumption is 35 cubic meters with a standard deviation of 5 cubic meter. Test the hypothesis that the average monthly water consumption is 34 cubic meters at 1% level of significance.
1. A random sample of 49 business establishments shows that the average monthly water consumption is 35 cubic meters with a standard deviation of 5 cubic meter. Test the hypothesis that the average monthly water consumption is 34 cubic meters at 1% level of significance.

MATLAB: An Introduction with Applications
6th Edition
ISBN:9781119256830
Author:Amos Gilat
Publisher:Amos Gilat
Chapter1: Starting With Matlab
Section: Chapter Questions
Problem 1P

Related questions

Question
100%
kindly help me answer this with solutions about hypotheses and rejection regions
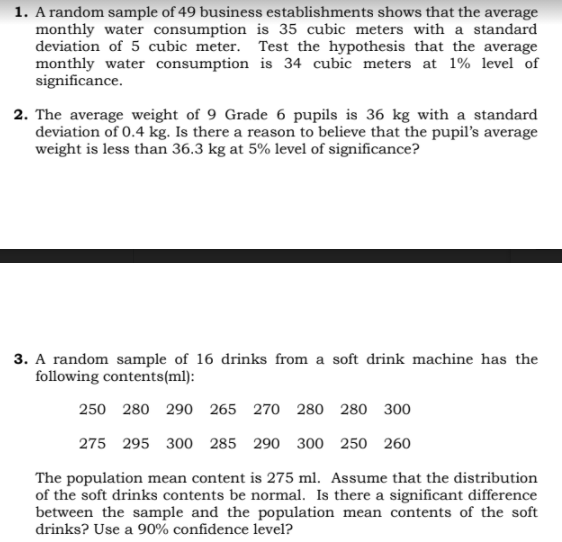
Transcribed Image Text:1. A random sample of 49 business establishments shows that the average
monthly water consumption is 35 cubic meters with a standard
deviation of 5 cubic meter. Test the hypothesis that the average
monthly water consumption is 34 cubic meters at 1% level of
significance.
2. The average weight of 9 Grade 6 pupils is 36 kg with a standard
deviation of 0.4 kg. Is there a reason to believe that the pupil's average
weight is less than 36.3 kg at 5% level of significance?
3. A random sample of 16 drinks from a soft drink machine has the
following contents(ml):
250 280 290 265 270 280 280 300
275 295 300 285 290 300 250 260
The population mean content is 275 ml. Assume that the distribution
of the soft drinks contents be normal. Is there a significant difference
between the sample and the population mean contents of the soft
drinks? Use a 90% confidence level?
Expert Solution
This question has been solved!
Explore an expertly crafted, step-by-step solution for a thorough understanding of key concepts.

This is a popular solution!

Trending now
This is a popular solution!

Step by step
Solved in 2 steps

Knowledge Booster


Learn more about
Need a deep-dive on the concept behind this application? Look no further. Learn more about this topic, statistics and related others by exploring similar questions and additional content below.Recommended textbooks for you
MATLAB: An Introduction with Applications
Statistics
ISBN:
9781119256830
Author:
Amos Gilat
Publisher:
John Wiley & Sons Inc

Probability and Statistics for Engineering and th…
Statistics
ISBN:
9781305251809
Author:
Jay L. Devore
Publisher:
Cengage Learning

Statistics for The Behavioral Sciences (MindTap C…
Statistics
ISBN:
9781305504912
Author:
Frederick J Gravetter, Larry B. Wallnau
Publisher:
Cengage Learning
MATLAB: An Introduction with Applications
Statistics
ISBN:
9781119256830
Author:
Amos Gilat
Publisher:
John Wiley & Sons Inc
Probability and Statistics for Engineering and th…
Statistics
ISBN:
9781305251809
Author:
Jay L. Devore
Publisher:
Cengage Learning
Statistics for The Behavioral Sciences (MindTap C…
Statistics
ISBN:
9781305504912
Author:
Frederick J Gravetter, Larry B. Wallnau
Publisher:
Cengage Learning

Elementary Statistics: Picturing the World (7th E…
Statistics
ISBN:
9780134683416
Author:
Ron Larson, Betsy Farber
Publisher:
PEARSON

The Basic Practice of Statistics
Statistics
ISBN:
9781319042578
Author:
David S. Moore, William I. Notz, Michael A. Fligner
Publisher:
W. H. Freeman

Introduction to the Practice of Statistics
Statistics
ISBN:
9781319013387
Author:
David S. Moore, George P. McCabe, Bruce A. Craig
Publisher:
W. H. Freeman