Illustration 54. From the following data relating to the average quarterly prices of a commodity obtain the scasonal indices by the method given by prof. Pearson. Also comment on the seasonal indices. Average Quarterly Prices of a Commodity Qrs. I II III IV Yr. 30 26 22 31 1994 1995 35 28 22 36 1996 31 29 28 32 1997 31 31 25 35 34 36 26 33 1098
Illustration 54. From the following data relating to the average quarterly prices of a commodity obtain the scasonal indices by the method given by prof. Pearson. Also comment on the seasonal indices. Average Quarterly Prices of a Commodity Qrs. I II III IV Yr. 30 26 22 31 1994 1995 35 28 22 36 1996 31 29 28 32 1997 31 31 25 35 34 36 26 33 1098

Chapter3: Functions
Section3.3: Rates Of Change And Behavior Of Graphs
Problem 27SE: Table 4 gives the population of a town (in thousand) from 2000 to 2008. What was the average rate of...

Related questions
Question
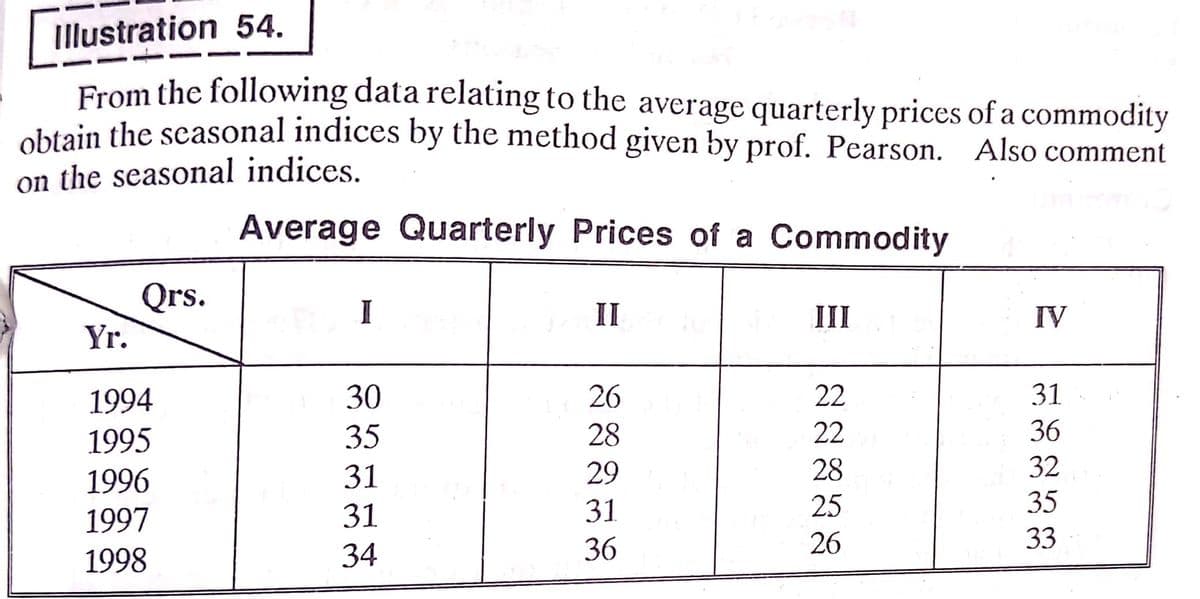
Transcribed Image Text:Illustration 54.
From the following data relating to the average quarterly prices of a commodity
obtain the scasonal indices by the method given by prof. Pearson. Also comment
on the seasonal indices.
Average Quarterly Prices of a Commodity
Qrs.
II
III
IV
Yr.
1994
30
26
22
31
1995
35
28
22
36
1996
31
29
28
32
25
35
31
36
1997
31
26
33
1998
34
Expert Solution
This question has been solved!
Explore an expertly crafted, step-by-step solution for a thorough understanding of key concepts.

Step by step
Solved in 2 steps with 2 images

Recommended textbooks for you

College Algebra (MindTap Course List)
Algebra
ISBN:
9781305652231
Author:
R. David Gustafson, Jeff Hughes
Publisher:
Cengage Learning

Glencoe Algebra 1, Student Edition, 9780079039897…
Algebra
ISBN:
9780079039897
Author:
Carter
Publisher:
McGraw Hill
College Algebra (MindTap Course List)
Algebra
ISBN:
9781305652231
Author:
R. David Gustafson, Jeff Hughes
Publisher:
Cengage Learning
Glencoe Algebra 1, Student Edition, 9780079039897…
Algebra
ISBN:
9780079039897
Author:
Carter
Publisher:
McGraw Hill

Holt Mcdougal Larson Pre-algebra: Student Edition…
Algebra
ISBN:
9780547587776
Author:
HOLT MCDOUGAL
Publisher:
HOLT MCDOUGAL

Functions and Change: A Modeling Approach to Coll…
Algebra
ISBN:
9781337111348
Author:
Bruce Crauder, Benny Evans, Alan Noell
Publisher:
Cengage Learning