1. A step-by-step hypothesis test for a repeated-measures design Consider the following data from a repeated-measures design. You want to use a repeated- measures t test to test the null hypothesis H,: PD = 0 (the null hypothesis states that the mean difference for the general population is zero). The data consist of five observations, each with two measurements, A and B, taken before and after a treatment. Assume the population of the differences in these measurements are normally distributed. Complete the following table by calculating the differences and the squared differences: Difference Score Squared Difference Score (D = B - A) Observation (D²) 12 10 11 12 3 17 16 4 10 11 16 18 The mean difference score is M= For a repeated-measures t test, you need to calculate the t statistic, which requires you to calculate s and SMD What is the estimated standard deviation of the difference scores? v 10.80 / What is the estimated standard error of the mean difference scores? (Note: For best results, retain at least six decimal places from your calculation of s.) SMD - s/ What is the t statistic for the repeated-measures t test to test the null hypothesis Hạ: Hu = 0? 0.27 t Distribution Degrees of Freedom -1.0 -2.0 -1.0 4.711 1.0 0.711 1.0 You conduct a two-tailed test at a = .05. To use the Distributions tool to find the critical values, you first need to set the degrees of freedom in the tool. The degrees of freedom are The critical values (the values for t scores that separate the tails from the main body of the distribution, forming the critical region) are Finally, since the t statistic in the critical region, you the null hypothesis.
1. A step-by-step hypothesis test for a repeated-measures design Consider the following data from a repeated-measures design. You want to use a repeated- measures t test to test the null hypothesis H,: PD = 0 (the null hypothesis states that the mean difference for the general population is zero). The data consist of five observations, each with two measurements, A and B, taken before and after a treatment. Assume the population of the differences in these measurements are normally distributed. Complete the following table by calculating the differences and the squared differences: Difference Score Squared Difference Score (D = B - A) Observation (D²) 12 10 11 12 3 17 16 4 10 11 16 18 The mean difference score is M= For a repeated-measures t test, you need to calculate the t statistic, which requires you to calculate s and SMD What is the estimated standard deviation of the difference scores? v 10.80 / What is the estimated standard error of the mean difference scores? (Note: For best results, retain at least six decimal places from your calculation of s.) SMD - s/ What is the t statistic for the repeated-measures t test to test the null hypothesis Hạ: Hu = 0? 0.27 t Distribution Degrees of Freedom -1.0 -2.0 -1.0 4.711 1.0 0.711 1.0 You conduct a two-tailed test at a = .05. To use the Distributions tool to find the critical values, you first need to set the degrees of freedom in the tool. The degrees of freedom are The critical values (the values for t scores that separate the tails from the main body of the distribution, forming the critical region) are Finally, since the t statistic in the critical region, you the null hypothesis.

MATLAB: An Introduction with Applications
6th Edition
ISBN:9781119256830
Author:Amos Gilat
Publisher:Amos Gilat
Chapter1: Starting With Matlab
Section: Chapter Questions
Problem 1P

Related questions
Question
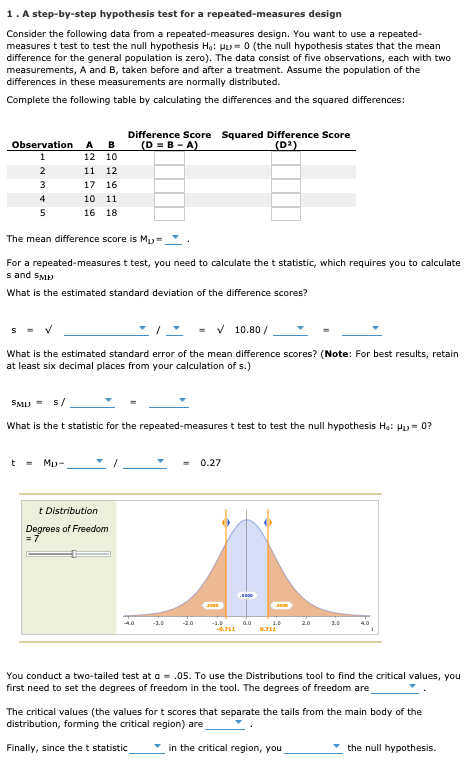
Transcribed Image Text:1. A step-by-step hypothesis test for a repeated-measures design
Consider the following data from a repeated-measures design. You want to use a repeated-
measures t test to test the null hypothesis H,: PD = 0 (the null hypothesis states that the mean
difference for the general population is zero). The data consist of five observations, each with two
measurements, A and B, taken before and after a treatment. Assume the population of the
differences in these measurements are normally distributed.
Complete the following table by calculating the differences and the squared differences:
Difference Score Squared Difference Score
(D = B - A)
Observation
(D²)
12 10
11
12
3
17
16
4
10
11
16
18
The mean difference score is M=
For a repeated-measures t test, you need to calculate the t statistic, which requires you to calculate
s and SMD
What is the estimated standard deviation of the difference scores?
v 10.80 /
What is the estimated standard error of the mean difference scores? (Note: For best results, retain
at least six decimal places from your calculation of s.)
SMD -
s/
What is the t statistic for the repeated-measures t test to test the null hypothesis Hạ: Hu = 0?
0.27
t Distribution
Degrees of Freedom
-1.0
-2.0
-1.0
4.711
1.0
0.711
1.0
You conduct a two-tailed test at a = .05. To use the Distributions tool to find the critical values, you
first need to set the degrees of freedom in the tool. The degrees of freedom are
The critical values (the values for t scores that separate the tails from the main body of the
distribution, forming the critical region) are
Finally, since the t statistic
in the critical region, you
the null hypothesis.
Expert Solution
This question has been solved!
Explore an expertly crafted, step-by-step solution for a thorough understanding of key concepts.

This is a popular solution!

Trending now
This is a popular solution!

Step by step
Solved in 7 steps with 13 images

Recommended textbooks for you
MATLAB: An Introduction with Applications
Statistics
ISBN:
9781119256830
Author:
Amos Gilat
Publisher:
John Wiley & Sons Inc

Probability and Statistics for Engineering and th…
Statistics
ISBN:
9781305251809
Author:
Jay L. Devore
Publisher:
Cengage Learning

Statistics for The Behavioral Sciences (MindTap C…
Statistics
ISBN:
9781305504912
Author:
Frederick J Gravetter, Larry B. Wallnau
Publisher:
Cengage Learning
MATLAB: An Introduction with Applications
Statistics
ISBN:
9781119256830
Author:
Amos Gilat
Publisher:
John Wiley & Sons Inc
Probability and Statistics for Engineering and th…
Statistics
ISBN:
9781305251809
Author:
Jay L. Devore
Publisher:
Cengage Learning
Statistics for The Behavioral Sciences (MindTap C…
Statistics
ISBN:
9781305504912
Author:
Frederick J Gravetter, Larry B. Wallnau
Publisher:
Cengage Learning

Elementary Statistics: Picturing the World (7th E…
Statistics
ISBN:
9780134683416
Author:
Ron Larson, Betsy Farber
Publisher:
PEARSON

The Basic Practice of Statistics
Statistics
ISBN:
9781319042578
Author:
David S. Moore, William I. Notz, Michael A. Fligner
Publisher:
W. H. Freeman

Introduction to the Practice of Statistics
Statistics
ISBN:
9781319013387
Author:
David S. Moore, George P. McCabe, Bruce A. Craig
Publisher:
W. H. Freeman