Independent random samples were selected from two quantitative populations, with sample sizes, means, and variances given below. Population 1 2 Sample Size 38 45 Sample Mean 9.6 7.3 Sample Variance 10.83 16.49 State the null and alternative hypotheses used to test for a difference in the two population means. О но: (и, - н2) + 0 versus Hа: (и, - и2) %3D 0 О но: (и, - н2) %3D 0 versus Hа: (и, — и2) > о O Ho: (H1 - H2) = 0 versus H: (H1 - H2) + 0 O Ho: (H1 - H2) = 0 versus H,: (H1 - 2) < 0 O Ho: (H1 - H2) < 0 versus H3: (41 - 42) > 0 Calculate the necessary test statistic. (Round your answer to two decimal places.) z = 2.77 Calculate the rejection region with a = 0.01. (Round your answers to two decimal places. If the test is one-tailed, enter NONE for the unused region.) z > 2.77 z < 2.77 Draw the appropriate conclusion. O H, is not rejected. There is insufficient evidence to indicate a difference in mean. H, is not rejected. There is sufficient evidence to indicate a difference in mean. O H, is rejected. There is insufficient evidence to indicate a difference in mean. O H, is rejected. There is sufficient evidence to indicate a difference in mean.
Independent random samples were selected from two quantitative populations, with sample sizes, means, and variances given below. Population 1 2 Sample Size 38 45 Sample Mean 9.6 7.3 Sample Variance 10.83 16.49 State the null and alternative hypotheses used to test for a difference in the two population means. О но: (и, - н2) + 0 versus Hа: (и, - и2) %3D 0 О но: (и, - н2) %3D 0 versus Hа: (и, — и2) > о O Ho: (H1 - H2) = 0 versus H: (H1 - H2) + 0 O Ho: (H1 - H2) = 0 versus H,: (H1 - 2) < 0 O Ho: (H1 - H2) < 0 versus H3: (41 - 42) > 0 Calculate the necessary test statistic. (Round your answer to two decimal places.) z = 2.77 Calculate the rejection region with a = 0.01. (Round your answers to two decimal places. If the test is one-tailed, enter NONE for the unused region.) z > 2.77 z < 2.77 Draw the appropriate conclusion. O H, is not rejected. There is insufficient evidence to indicate a difference in mean. H, is not rejected. There is sufficient evidence to indicate a difference in mean. O H, is rejected. There is insufficient evidence to indicate a difference in mean. O H, is rejected. There is sufficient evidence to indicate a difference in mean.

MATLAB: An Introduction with Applications
6th Edition
ISBN:9781119256830
Author:Amos Gilat
Publisher:Amos Gilat
Chapter1: Starting With Matlab
Section: Chapter Questions
Problem 1P

Related questions
Question
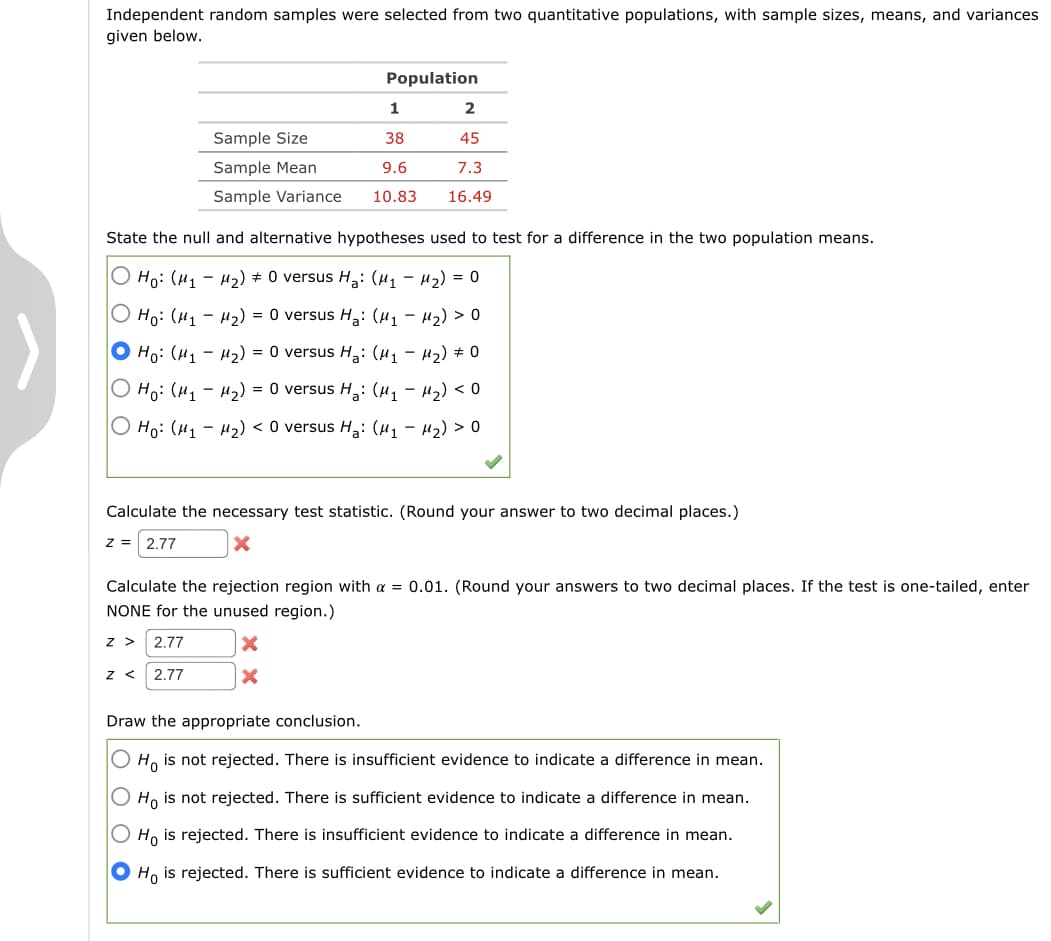
Transcribed Image Text:Independent random samples were selected from two quantitative populations, with sample sizes, means, and variances
given below.
Population
1
Sample Size
38
45
Sample Mean
9.6
7.3
Sample Variance
10.83
16.49
State the null and alternative hypotheses used to test for a difference in the two population means.
О н: (и, - н2) + 0 versus Hа: (и, - и2) %3D 0
О на: (и, - и2) %3D 0 versus H,: (и, — и2) > о
О на: (и, - и2) %3D 0 versus Hа: (и, — и2) + 0
О н: (и, — и,) %3D 0 versus H,: (и, — и) < 0
О Hо: (и1 — н2) <0 versus Hа: (И1 — и2) > о
Calculate the necessary test statistic. (Round your answer to two decimal places.)
z =
2.77
Calculate the rejection region with a = 0.01. (Round your answers to two decimal places. If the test is one-tailed, enter
NONE for the unused region.)
z > 2.77
z < 2.77
Draw the appropriate conclusion.
O H, is not rejected. There is insufficient evidence to indicate a difference in mean.
Ho is not rejected. There is sufficient evidence to indicate a difference in mean.
O Ho is rejected. There is insufficient evidence to indicate a difference in mean.
O Ho is rejected. There is sufficient evidence to indicate a difference in mean.
Expert Solution
This question has been solved!
Explore an expertly crafted, step-by-step solution for a thorough understanding of key concepts.

This is a popular solution!

Trending now
This is a popular solution!

Step by step
Solved in 4 steps with 1 images

Recommended textbooks for you
MATLAB: An Introduction with Applications
Statistics
ISBN:
9781119256830
Author:
Amos Gilat
Publisher:
John Wiley & Sons Inc

Probability and Statistics for Engineering and th…
Statistics
ISBN:
9781305251809
Author:
Jay L. Devore
Publisher:
Cengage Learning

Statistics for The Behavioral Sciences (MindTap C…
Statistics
ISBN:
9781305504912
Author:
Frederick J Gravetter, Larry B. Wallnau
Publisher:
Cengage Learning
MATLAB: An Introduction with Applications
Statistics
ISBN:
9781119256830
Author:
Amos Gilat
Publisher:
John Wiley & Sons Inc
Probability and Statistics for Engineering and th…
Statistics
ISBN:
9781305251809
Author:
Jay L. Devore
Publisher:
Cengage Learning
Statistics for The Behavioral Sciences (MindTap C…
Statistics
ISBN:
9781305504912
Author:
Frederick J Gravetter, Larry B. Wallnau
Publisher:
Cengage Learning

Elementary Statistics: Picturing the World (7th E…
Statistics
ISBN:
9780134683416
Author:
Ron Larson, Betsy Farber
Publisher:
PEARSON

The Basic Practice of Statistics
Statistics
ISBN:
9781319042578
Author:
David S. Moore, William I. Notz, Michael A. Fligner
Publisher:
W. H. Freeman

Introduction to the Practice of Statistics
Statistics
ISBN:
9781319013387
Author:
David S. Moore, George P. McCabe, Bruce A. Craig
Publisher:
W. H. Freeman