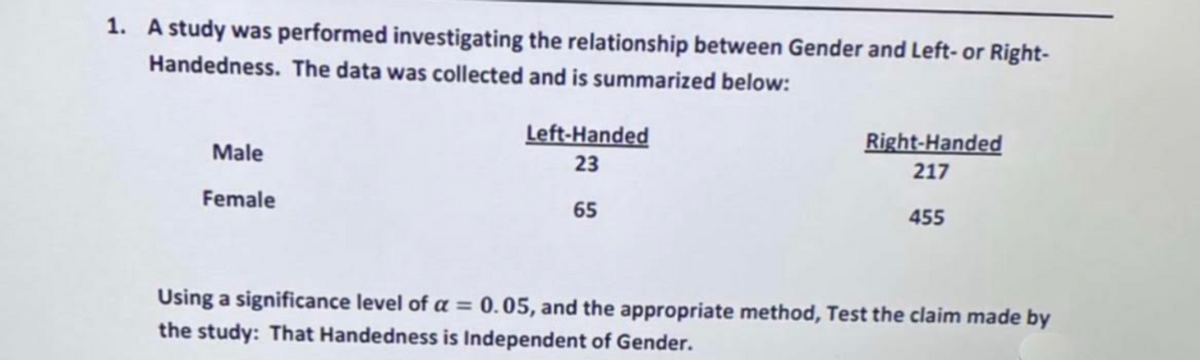
1. A study was performed investigating the relationship between Gender and Left- or Right- Handedness. The data was collected and is summarized below: Left-Handed Right-Handed Male 23 217 Female 65 455 Using a significance level of a = 0.05, and the appropriate method, Test the claim made by the study: That Handedness is Independent of Gender.


Q: Consider the following computer output: Test of mu = 91 vs > 91 Variable N Mean StDev SE Mean x 20…
A: It is given that the sample size is 20.
Q: The table below summarizes data from a survey of a sample of women. Using a 0.05 significance…
A: The given table is as follows:
Q: Test the claim that the proportion of men who own cats is significantly different than the…
A: Denote pM, pF as the true population proportions of men and women owned cats, respectively.
Q: I'm stuck on these types of prwctice problems and needa walk through. question: A random sample…
A: Given, n1 = 120 n2 = 150 p1 = 0.25 p2 = 0.36 Level of significance = α = 0.05 The null and…
Q: 4. A study in the July 7, 2009, issue of USA TODAY stated that the 401(k)-participation rate among…
A: From the provided information, Sample size (n) = 100 Sample proportion (p̂) = 0.66 Level of…
Q: Is there an association between hair color and body type? The table below shows the results of a…
A: There are two categorical variables which are hair color and body type. Hair color has 3 types which…
Q: 6, Ninety individuals, male and fenmale, were given a test in psychomator skills and their seores…
A: Note: Hi, thank you for the question. As per our company guideline we are supposed to answer only…
Q: The table below summarizes data from a survey of a sample of women. Using a 0.05 significance…
A: To Identify : the null and alternative hypotheses. Choose the correct answer below.
Q: a) Workers and senior-level bosses were asked if it was seriously unethical to monitor employee…
A: The data is given by : Yes No Workers 192 244 Bosses 40 81 To test that :…
Q: A food services manager wants to know if there is a relationship between gender (male or female) and…
A: 1. It is needed to test, whether the there is a relationship between gender (male or female) and…
Q: You wish to test the following claim (Ha) at a significance level of a = 0.005. Ho:P1 = P2 Ha:P1 P2…
A: Assume that p1 is true proportion of success in 1st population and p2 is the true proportion of…
Q: The director of student services at Oxnard College is interested in whether women are just as likely…
A: Solution We will use z test for two sample proportion A) Ho : P1 = P2 H1 : P1 < P2 B) n1 = 601,…
Q: The article “HIV-positive Smokers Considering Quitting: Differences by Race/Ethnicity” (E.…
A: Note: here, MINITAB software is used to obtain the hypothesis test for proportion. In a group of 230…
Q: (a) The ministry of education is considering funding pre-school education. Before making their…
A: Since you asked multiple questions, we will solve the first question for you. If you want any…
Q: A researcher surveyed randomly selected Democrats and Republicans asking them what the number one…
A: a. The test is check whether there is evidence to conclude that there is difference in what…
Q: The director of student services at Oxnard College is interested in whether women are more likely to…
A: Instruction : "please answer d, e, f" For Women: Sample size , n1 = 386 + 275= 661 sample…
Q: In a previous poll, 47% of adults with children under the age of 18 reported that their family ate…
A: The hypothesized proportion is 0.47.
Q: Process A is applied to the first of two groups of seven units, and B process is applied to the…
A: The following data for process is given as follows. Process A : x1 Process B : x2 18 13 19 7…
Q: 1. A budget head for SSS Sales Inc. would like to compare the daily travel expenses for the sales…
A: We’ll answer the first question since the exact one wasn’t specified. Please submit a new question…
Q: You wish to test the following daim (Ha) at a significance level of a = 0.10. H.:P1 = P2 Ha:P1 + P2…
A: Given data: Significance level = 0.10
Q: 1. Is there a relationship between buying organic produce and having a college degree for males and…
A: As per our guidelines, we are allowed to answer first question only. Thanks 1) The row and column…
Q: Test at the 4% significance level if the proportion of men who have a tattoo is or is not close to…
A: Here use single proportion z test
Q: Is there an association between hair color and body type? The table below shows the results of a…
A: H0: There is no association between hair color and body type. H1: The is an association between…
Q: ale below summarizes data from a survey of a sample of women. Using a 0.05 significance level, and…
A:
Q: If you plan to test if there is a difference in the blood pressure for men and women, answer the…
A: The following table shows the systolic blood pressure of 5 women and 5 men. Women 110 120…
Q: In an experiment to study the relationship between hypertension (high blood pressure) and snoking…
A: a) This is a purposive study as Researchers use purposive sampling when they want to access a…
Q: 21. A Canadian railway company claims that its trains block crossings no more than 8 minutes per…
A: Data 10.1,9.5,6.5,8,8.8,12,7.2,10.5,8.2,9.3
Q: Jacqueline, a medical researcher, would like to make the claim that a newly developed prescription…
A: Note:Hey there! Thank you for the question. As the graph attached with your question is in an image…
Q: . Suppose we are interested in the relationship between individuals’ place of residence (rural…
A:
Q: 4. A professor claimed that there was no difference in (population) mean college grade- point…
A: Given data is :
Q: Test the claim that the proportion of men who own cats is significantly different than the…
A: From the provided information, Level of significance (α) = 0.2
Q: The director of student services at Oxnard College is interested in whether women are more likely to…
A: From the provided information,
Q: To compare customer satisfaction levels of two competing cable television companies, 174 customers…
A: We have given that Sample size n1=174 , n2= 355 Sample mean xbar1 = 3.51 , xbar2 = 3.24 Standard…
Q: When a person states at the outset of an experiment that a higher average score will be received by…
A: Given that : The higher average score will be recevied by a group receiving some kind of treatment…
Q: A food services manager for a baseball park wants to knowif there is a relationship between gender…
A: Given: Level of significance (α) = 10% that is 0.10 The hypotheses can be constructed as: H0: There…
Q: Kevin, a Human Resources professional, would like to make the claim that the average hourly wage for…
A: The null and alternative hypothesis is, significance level =α=0.01 The value of test statistic is,…
Q: The table below summarizes data from a survey of a sample of women. Using a 0.01 significance…
A: Here it is needed to test, whether the proportions of agree/disagree responses are the same for…
Q: A study regarding the relationship between age and the amount of pressure sales personnel feel in…
A:
Q: Is the proportion of wildfires caused by humans in the south different from the proportion of…
A: Given : x1= 350.0 n1= 519 x2= 383.0 n2= 500 significance level, 0.01
Q: You wish to test the following daim (Ha) at a significance level of a = 0.10. H.:P1 P2
A:
Q: Persons who visit the restroom of a certain fast-food outlet were asked to state their opinion of…
A: i) It needed to test whether there is an association between the gender of persons and their…
Q: he table below summarizes data from a survey of a sample of women. Using a 0.05 significance level,…
A: The test statistic for chi-square distribution is, χ2=∑O-E2EHere, O is the observed frequency and E…
Q: A new medication for lowering blood pressure is being tested. Sample 1 has systolic blood pressures…
A: There are independent samples which are sample 1 and sample 2. We have to test whether there is a…
Q: A. For which data set is the sample correlation coefficient r closest to −1? B. For which data set…
A:
Q: Nancy, an economist, would like to make the claim that the average weekly grocery budget for…
A: From the given information, it can be observed the test statistic is –0.75.
Q: The director of student services at Oxnard College is interested in whether women are less likely to…
A: Given data : x1= 419.0 n1= 642 x2= 437.0 n2= 626 significance level,…
Q: 4. The following table shows the opinions of a random sample of students classified according to sex…
A:
Q: Suppose that, in a comparison of two holiday companies’ customers, of the 75 who went with Happy…
A: Given data : x1= 45 n1= 75 x2= 48 n2= 90 significance level, 0.025
Q: You wish to test the following claim (Ha) at a significance level of a = 0.10. H.:P1 H.:P1 > P2 P2…
A:

Step by step
Solved in 4 steps with 4 images


- The table below summarizes data from a survey of a sample of women. Using a 0.01 significance level, and assuming that the sample sizes of 900 men and 400 women are predetermined, test the claim that the proportions of agree/disagree responses are the same for subjects interviewed by men and the subjects interviewed by women. Does it appear that the gender of the interviewer affected the responses of women?9. A random sample of 135 people yielded the following contingency table describing the relationship between migraine headaches and caffeine consumption (low, medium, high). Caffeine Consumption Low Med. High Migraine 5 8 15 No Migraine 35 42 30 Suppose we wish to test H0 : caffeine and migraines are independent versus Ha : caffeine and migraines are not independent at the α = 0.05 significance level. What is the value of the test statistic and p−value? 10. In reference to question (9), which of the following is/are true? (A) There is not a significant association between caffeine and migraines (B) The test statistic does not fall in the rejection region (C) The critical value is equal to 7.38 D) The expected counts eij are computed assuming caffeine and migraines are independentA veterinarian is interested in researching the proportion of men and women cat owners and believes that the proportion of men cat owners is significantly different than the proportion of women cat owners. The veterinarian decides to obtain two independent samples of men and women cat owners and finds from one sample of 80 men, 30% owned cats. In the second sample of 60 women, 55% owned cats. Test the veterinarian's belief at the α=0.05α=0.05 significance level. Preliminary: Is it safe to assume that nmen≤5%nmen≤5% of all men and nwomen≤5%nwomen≤5% of all women? Yes No Verify nˆp(1−ˆp)≥10.np^(1-p^)≥10. Round your answer to one decimal place.nmenˆp(1−ˆp)=nmenp^(1-p^)= nwomenˆp(1−ˆp)=nwomenp^(1-p^)= Test the claim: Determine the null and alternative hypotheses. H0H0: pmenpmen pwomenpwomen HaHa: pmenpmen pwomenpwomen The hypothesis test is left-tailed two-tailed right-tailed Determine the test statistic. Round to two decimal places.x=x= Find the pp-value.…
- 10. The research department at the home office of Superior Insurance conducts ongoing research on the causes of automobile accidents, the characteristics of the drivers, and so on. A random sample of 400 policies written on single persons revealed 120 had at least one accident in the previous three- year period. Similarly, a sample of 600 policies written on married persons revealed that 150 had been in at least one accident. At the 0.05 significance level, is there a significant difference in the proportions of single and married persons having an accident during a three-year period? Determine and interpret the p- value.A city is collecting data on two neighborhoods, one low income and one middle income, to see whether or not their residents would support an increase in local sales tax to pay for more city services. The city wishes to see if there is evidence to show that the first neighborhood (low income) has a lower level of support for the tax compared to the second neighborhood (middle income).You wish to test the following claim (HaHa) at a significance level of α=0.002 Ho:p1=p2 Ha:p1<p2You obtain a sample from the first population with 219 successes and 131 failures. You obtain a sample from the second population with 177 successes and 53 failures.What is the test statistic for this sample? (Report answer accurate to three decimal places.)test statistic = What is the p-value for this sample? (Report answer accurate to four decimal places.)p-value = The p-value is... less than (or equal to) αα greater than αα This test statistic leads to a decision to... reject the null accept…The article “HIV-positive Smokers Considering Quitting: Differences by Race/Ethnicity” (E. Lloyd-Richardson, C. Stanton, et al., Am J Health Behav, 2008:3–15) reported that in a group of 230 European-American HIV-positive smokers, 102 of them had used a nicotine patch to try to quit smoking, and in a group of 72 Hispanic-American HIV-positive smokers, 20 had used a nicotine patch. Can you conclude that the proportion of patch users is greater among European-Americans?
- Independent random samples of 32 people living on the west side of a city and 30 people living on the east side of a city were taken to determine if the income levels of west side residents are significantly different from the income levels of east side residents. Given the testing statistics below, determine if the data provides sufficient evidence to conclude that the income levels of west side residents are significantly different from the income levels of east side residents, at the 2% significance level. H0:μw=μeHa:μw≠μe t0=2.364 t0.01=±2.099 Select the correct answer below: No; the test statistic is not between the critical values. No; the test statistic is between the critical values. Yes; the test statistic is not between the critical values. Yes; the test statistic is between the critical values.The table below summarizes data from a survey of a sample of women. Using a 0.01 significance level, and assuming that the sample sizes of 700 men and 300 women are predetermined, test the claim that the proportions of agree/disagree responses are the same for subjects interviewed by men and the subjects interviewed by women. Does it appear that the gender of the interviewer affected the responses of women? Gender of Interviewer Man Woman Women who agree 482 237 Women who disagree 218 63 Identify the null and alternative hypotheses. Compute the test statistic. Find the critical value(s). What is the conclusion based on the hypothesis test?The table below summarizes data from a survey of a sample of women. Using a 0.05 significance level, and assuming that the sample sizes of 900 men and 400 women are predetermined, test the claim that the proportions of agree/disagree responses are the same for subjects interviewed by men and the subjects interviewed by women. Does it appear that the gender of the interviewer affected the responses of women? Gender of Interviewer Man Woman Women who agree 532 349 Women who disagree 368 51 Identify the null and alternative hypotheses. Compute the test statistic. Find the critical value(s). What is the conclusion based on the hypothesis test? Reject or fail to reject? Is there sufficient evidence? Does it appear that the gender of the interviewer affected the responses of women?
- In a study to determine if the nitrogen content of the soil in Wyoming is significantly different from the nitrogen content of the soil in North Dakota, 34 independent random soil samples from Wyoming and 36 from North Dakota were taken. Given the testing statistics below, determine if the data provides sufficient evidence to conclude that the nitrogen content of the soil in Wyoming is significantly different from the nitrogen content of the soil in North Dakota, at the 1% significance level. H0:μw=μnHa:μw≠μn The test statistic is t0=2.653 t0.005=±2.382Do you believe that more than 92% of google play apps are free? to answer the question above, a sample of 1000 google play apps was collected and 932 of them was found to be free. a). does this data provide strong evidence (at 5% level) that more than 92% of google play apps are free? b). what is your conclusion if the significance level now is 10%?4. A researcher claims that the percentage of infants who receiveimmunizations is less than 80%. She selects a sample of size 750 infantsand 573 have received immunizations. At a 5 % significance level, what conclusion should the researchersmake?