To compare customer satisfaction levels of two competing cable television companies, 174 customers of Company 1 and 355 customers of Company 2 were randomly selected and were asked to rate their cable companies on a five-point scale, with 1 being least satisfied and 5 being most satisfied. The survey results are summarized in the following table. Company 1 Company 2 174 355 I1 = 3.51 T2 = 3.24 %3D $1 = 0.51 0.52 S2 = It is desired to test, at a 0.01 level of significance, whether the data provide sufficient evidence to conclude that Company 1 has a higher mean satisfaction rating than does Company 2. Let µ1 and u2 denote the population mean satisfaction ratings for Company 1 and Company 2, respectively. We consider the hypotheses: Ho : µ1 - 2 = 0 versus H1 :µ1 - 2 > 0. The value of the test statistic is (Write your answer precise to two decimal places, e.g., 1.78, 2.56, -3.71, 0.35.) The data (write "do" or "do not") provide sufficient evidence, at the 0.01 level of significance, that the mean customer satisfaction for Company 1 is higher than that for Company 2.
To compare customer satisfaction levels of two competing cable television companies, 174 customers of Company 1 and 355 customers of Company 2 were randomly selected and were asked to rate their cable companies on a five-point scale, with 1 being least satisfied and 5 being most satisfied. The survey results are summarized in the following table. Company 1 Company 2 174 355 I1 = 3.51 T2 = 3.24 %3D $1 = 0.51 0.52 S2 = It is desired to test, at a 0.01 level of significance, whether the data provide sufficient evidence to conclude that Company 1 has a higher mean satisfaction rating than does Company 2. Let µ1 and u2 denote the population mean satisfaction ratings for Company 1 and Company 2, respectively. We consider the hypotheses: Ho : µ1 - 2 = 0 versus H1 :µ1 - 2 > 0. The value of the test statistic is (Write your answer precise to two decimal places, e.g., 1.78, 2.56, -3.71, 0.35.) The data (write "do" or "do not") provide sufficient evidence, at the 0.01 level of significance, that the mean customer satisfaction for Company 1 is higher than that for Company 2.

MATLAB: An Introduction with Applications
6th Edition
ISBN:9781119256830
Author:Amos Gilat
Publisher:Amos Gilat
Chapter1: Starting With Matlab
Section: Chapter Questions
Problem 1P

Related questions
Question
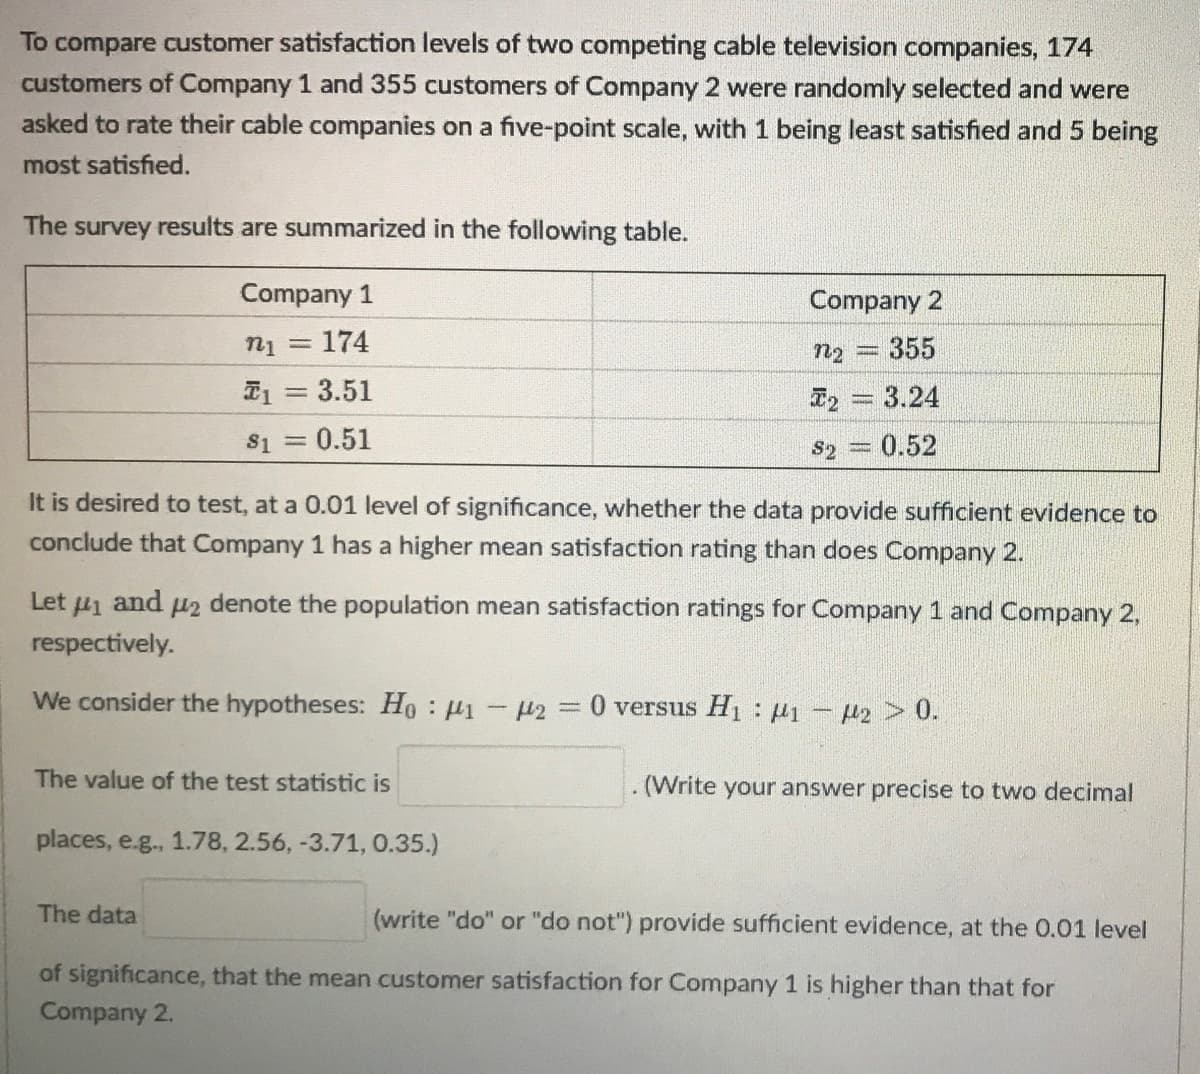
Transcribed Image Text:To compare customer satisfaction levels of two competing cable television companies, 174
customers of Company 1 and 355 customers of Company 2 were randomly selected and were
asked to rate their cable companies on a five-point scale, with 1 being least satisfied and 5 being
most satisfied.
The
survey
results are summarized in the following table.
Company 1
Company 2
= 174
n2 = 355
I1 = 3.51
T2 = 3.24
S1 = 0.51
S2 = 0.52
It is desired to test, at a 0.01 level of significance, whether the data provide sufficient evidence to
conclude that Company 1 has a higher mean satisfaction rating than does Company 2.
Let u1 and u2 denote the population mean satisfaction ratings for Company 1 and Company 2,
respectively.
We consider the hypotheses: Ho : µ1 - H2 = 0 versus H1: 1- P2 > 0.
%3D
The value of the test statistic is
(Write your answer precise to two decimal
places, e.g., 1.78, 2.56, -3.71, 0.35.)
The data
(write "do" or "do not") provide sufficient evidence, at the 0.01 level
of significance, that the mean customer satisfaction for Company 1 is higher than that for
Company 2.
Expert Solution
This question has been solved!
Explore an expertly crafted, step-by-step solution for a thorough understanding of key concepts.

This is a popular solution!

Trending now
This is a popular solution!

Step by step
Solved in 2 steps with 1 images

Recommended textbooks for you
MATLAB: An Introduction with Applications
Statistics
ISBN:
9781119256830
Author:
Amos Gilat
Publisher:
John Wiley & Sons Inc

Probability and Statistics for Engineering and th…
Statistics
ISBN:
9781305251809
Author:
Jay L. Devore
Publisher:
Cengage Learning

Statistics for The Behavioral Sciences (MindTap C…
Statistics
ISBN:
9781305504912
Author:
Frederick J Gravetter, Larry B. Wallnau
Publisher:
Cengage Learning
MATLAB: An Introduction with Applications
Statistics
ISBN:
9781119256830
Author:
Amos Gilat
Publisher:
John Wiley & Sons Inc
Probability and Statistics for Engineering and th…
Statistics
ISBN:
9781305251809
Author:
Jay L. Devore
Publisher:
Cengage Learning
Statistics for The Behavioral Sciences (MindTap C…
Statistics
ISBN:
9781305504912
Author:
Frederick J Gravetter, Larry B. Wallnau
Publisher:
Cengage Learning

Elementary Statistics: Picturing the World (7th E…
Statistics
ISBN:
9780134683416
Author:
Ron Larson, Betsy Farber
Publisher:
PEARSON

The Basic Practice of Statistics
Statistics
ISBN:
9781319042578
Author:
David S. Moore, William I. Notz, Michael A. Fligner
Publisher:
W. H. Freeman

Introduction to the Practice of Statistics
Statistics
ISBN:
9781319013387
Author:
David S. Moore, George P. McCabe, Bruce A. Craig
Publisher:
W. H. Freeman