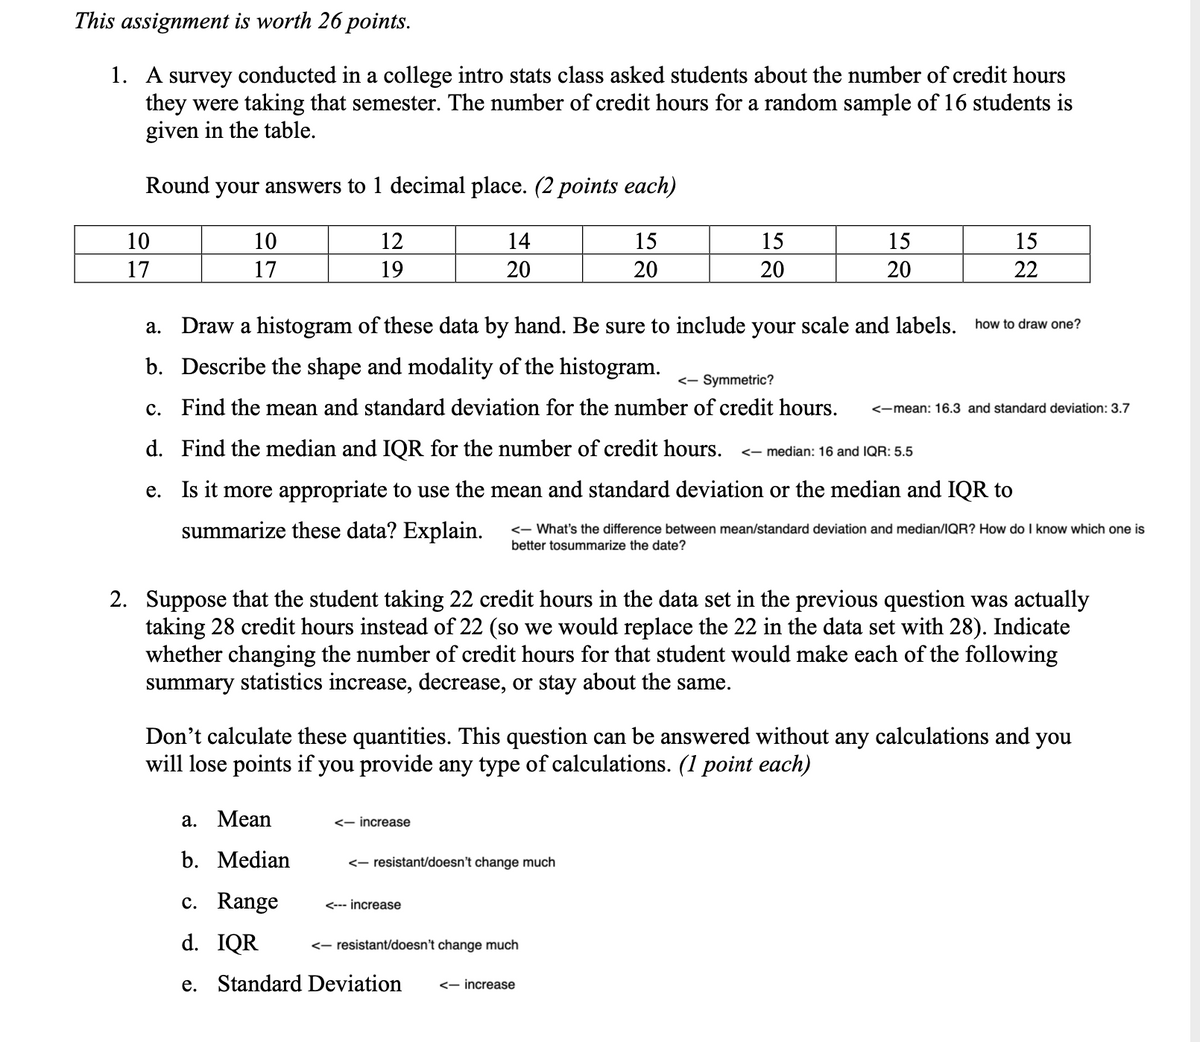
1. A survey conducted in a college intro stats class asked students about the number of credit hours they were taking that semester. The number of credit hours for a random sample of 16 students is given in the table. Round your answers to 1 decimal place. (2 points each) 10 10 12 14 15 15 15 15 17 17 19 20 20 20 20 22 a. Draw a histogram of these data by hand. Be sure to include your scale and labels. how to draw one? b. Describe the shape and modality of the histogram. <- Symmetric? c. Find the mean and standard deviation for the number of credit hours. <-mean: 16.3 and standard deviation: 3.7
1. A survey conducted in a college intro stats class asked students about the number of credit hours they were taking that semester. The number of credit hours for a random sample of 16 students is given in the table. Round your answers to 1 decimal place. (2 points each) 10 10 12 14 15 15 15 15 17 17 19 20 20 20 20 22 a. Draw a histogram of these data by hand. Be sure to include your scale and labels. how to draw one? b. Describe the shape and modality of the histogram. <- Symmetric? c. Find the mean and standard deviation for the number of credit hours. <-mean: 16.3 and standard deviation: 3.7

Glencoe Algebra 1, Student Edition, 9780079039897, 0079039898, 2018
18th Edition
ISBN:9780079039897
Author:Carter
Publisher:Carter
Chapter10: Statistics
Section10.4: Distributions Of Data
Problem 22PFA

Related questions
Question
100%
The questions I have are on the screenshots I have attached here. I don't know how to draw a histogram according to the numbers given in the data. I can see it on the graphing calculator but I don't know how to put that onto a piece of paper. Also, I don't get the last question at all. Also, I just want to double check that I'm answering the questions correctly. Thanks.
Transcribed Image Text:This assignment is worth 26 points.
1. A survey conducted in a college intro stats class asked students about the number of credit hours
they were taking that semester. The number of credit hours for a random sample of 16 students is
given in the table.
Round your answers to 1 decimal place. (2 points each)
10
10
12
14
15
15
15
15
17
17
19
20
20
20
20
22
a. Draw a histogram of these data by hand. Be sure to include your scale and labels. how to draw one?
b. Describe the shape and modality of the histogram.
<- Symmetric?
c. Find the mean and standard deviation for the number of credit hours.
<-mean: 16.3 and standard deviation: 3.7
d. Find the median and IQR for the number of credit hours.
<- median: 16 and IQR: 5.5
e. Is it more appropriate to use the mean and standard deviation or the median and IQR to
summarize these data? Explain.
<- What's the difference between mean/standard deviation and median/IQR? How do I know which one is
better tosummarize the date?
2. Suppose that the student taking 22 credit hours in the data set in the previous question was actually
taking 28 credit hours instead of 22 (so we would replace the 22 in the data set with 28). Indicate
whether changing the number of credit hours for that student would make each of the following
summary statistics increase, decrease, or stay about the same.
Don't calculate these quantities. This question can be answered without any calculations and you
will lose points if you provide any type of calculations. (1 point each)
а. Мean
<- increase
b. Median
<- resistant/doesn't change much
c. Range
d. IQR
<--- increase
<- resistant/doesn't change much
e. Standard Deviation
<- increase
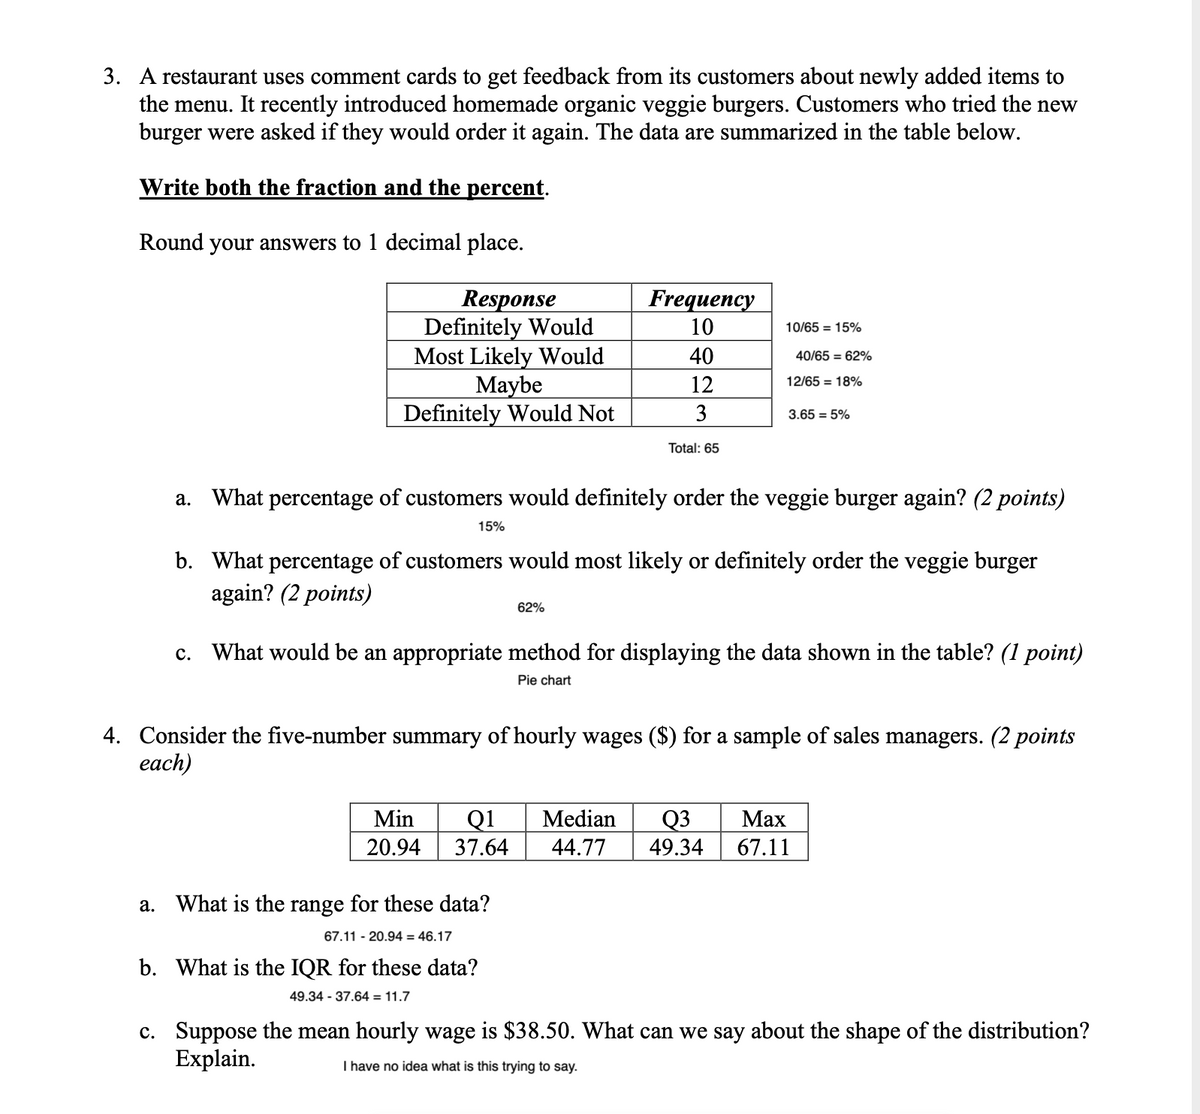
Transcribed Image Text:3. A restaurant uses comment cards to get feedback from its customers about newly added items to
the menu. It recently introduced homemade organic veggie burgers. Customers who tried the new
burger were asked if they would order it again. The data are summarized in the table below.
Write both the fraction and the percent.
Round your answers to 1 decimal place.
Response
Definitely Would
Most Likely Would
Maybe
Definitely Would Not
Frequency
10
10/65 = 15%
40
40/65 = 62%
12
12/65 = 18%
3
3.65 = 5%
Total: 65
a. What percentage of customers would definitely order the veggie burger again? (2 points)
15%
b. What percentage of customers would most likely or definitely order the veggie burger
again? (2 points)
62%
c. What would be an appropriate method for displaying the data shown in the table? (1 point)
Pie chart
4. Consider the five-number summary of hourly wages ($) for a sample of sales managers. (2 points
each)
Min
Median
Q1
37.64
Q3
49.34
Маx
20.94
44.77
67.11
a. What is the range for these data?
67.11 - 20.94 = 46.17
b. What is the IQR for these data?
49.34 - 37.64 = 11.7
c. Suppose the mean hourly wage is $38.50. What can we say about the shape of the distribution?
Explain.
I have no idea what is this trying to say.
Expert Solution
This question has been solved!
Explore an expertly crafted, step-by-step solution for a thorough understanding of key concepts.

This is a popular solution!

Trending now
This is a popular solution!

Step by step
Solved in 2 steps with 5 images

Recommended textbooks for you
Glencoe Algebra 1, Student Edition, 9780079039897…
Algebra
ISBN:
9780079039897
Author:
Carter
Publisher:
McGraw Hill
Glencoe Algebra 1, Student Edition, 9780079039897…
Algebra
ISBN:
9780079039897
Author:
Carter
Publisher:
McGraw Hill