(a) Find the least-squares regression line for males treating the number of licensed drivers as the explanatory variable, x, and the number of fatal crashes, y, as the response variable. Repeat this procedure for females. Find the least-squares regression line for males. =ロx+ロ (Round the slope to three decimal places and round the constant to the nearest integer as needed.) Find the least-squares regression line for females. y-ロ+ロ (Round the slope to three decimal places and round the constant to the nearest integer as needed.) (b) Interpret the slope of the least-squares regression line for each gender, if appropriate. How might an insurance company use this information? What is the correct interpretation of the slope of the least-squares regression line for males? Select the correct choice below and, if necessary, fill in the answer box to complete your choice. O A. If the number of fatal crashes increases by 1, then the number of male licensed drivers increases by thousand, on average. (Round to three decimal places as needed.) O B. If the number of male licensed drivers increases by 1 (thousand), then the number of fatal crashes increases by on average. (Round to three decimal places as needed.) O C. If the average age of all male licensed drivers increases by 1, then the number of fatal crashes increases by on average. (Round to three decimal places as needed.) O D. It does not make sense to interpret the slope. What is the correct interpretation of the slope of the least-squares regression line for females? Select the correct choice below and, if necessary, fill in the answer box to complete your choice. O A. If the average age of all female licensed drivers increases by 1, then the number of fatal crashes increases by (Round to three decimal places as needed.) on average. O B. If the number of female licensed drivers increases by 1 (thousand), then the number of fatal crashes increases by on average. (Round to three decimal places as needed.) O C. If the number of fatal crashes increases by 1, then the number of female licensed drivers increases by thousand, on average. (Round to three decimal places as needed.) O D. It does not make sense to interpret the slope.
(a) Find the least-squares regression line for males treating the number of licensed drivers as the explanatory variable, x, and the number of fatal crashes, y, as the response variable. Repeat this procedure for females. Find the least-squares regression line for males. =ロx+ロ (Round the slope to three decimal places and round the constant to the nearest integer as needed.) Find the least-squares regression line for females. y-ロ+ロ (Round the slope to three decimal places and round the constant to the nearest integer as needed.) (b) Interpret the slope of the least-squares regression line for each gender, if appropriate. How might an insurance company use this information? What is the correct interpretation of the slope of the least-squares regression line for males? Select the correct choice below and, if necessary, fill in the answer box to complete your choice. O A. If the number of fatal crashes increases by 1, then the number of male licensed drivers increases by thousand, on average. (Round to three decimal places as needed.) O B. If the number of male licensed drivers increases by 1 (thousand), then the number of fatal crashes increases by on average. (Round to three decimal places as needed.) O C. If the average age of all male licensed drivers increases by 1, then the number of fatal crashes increases by on average. (Round to three decimal places as needed.) O D. It does not make sense to interpret the slope. What is the correct interpretation of the slope of the least-squares regression line for females? Select the correct choice below and, if necessary, fill in the answer box to complete your choice. O A. If the average age of all female licensed drivers increases by 1, then the number of fatal crashes increases by (Round to three decimal places as needed.) on average. O B. If the number of female licensed drivers increases by 1 (thousand), then the number of fatal crashes increases by on average. (Round to three decimal places as needed.) O C. If the number of fatal crashes increases by 1, then the number of female licensed drivers increases by thousand, on average. (Round to three decimal places as needed.) O D. It does not make sense to interpret the slope.

Glencoe Algebra 1, Student Edition, 9780079039897, 0079039898, 2018
18th Edition
ISBN:9780079039897
Author:Carter
Publisher:Carter
Chapter4: Equations Of Linear Functions
Section4.6: Regression And Median-fit Lines
Problem 2CYU

Related questions
Question
Practice Pack
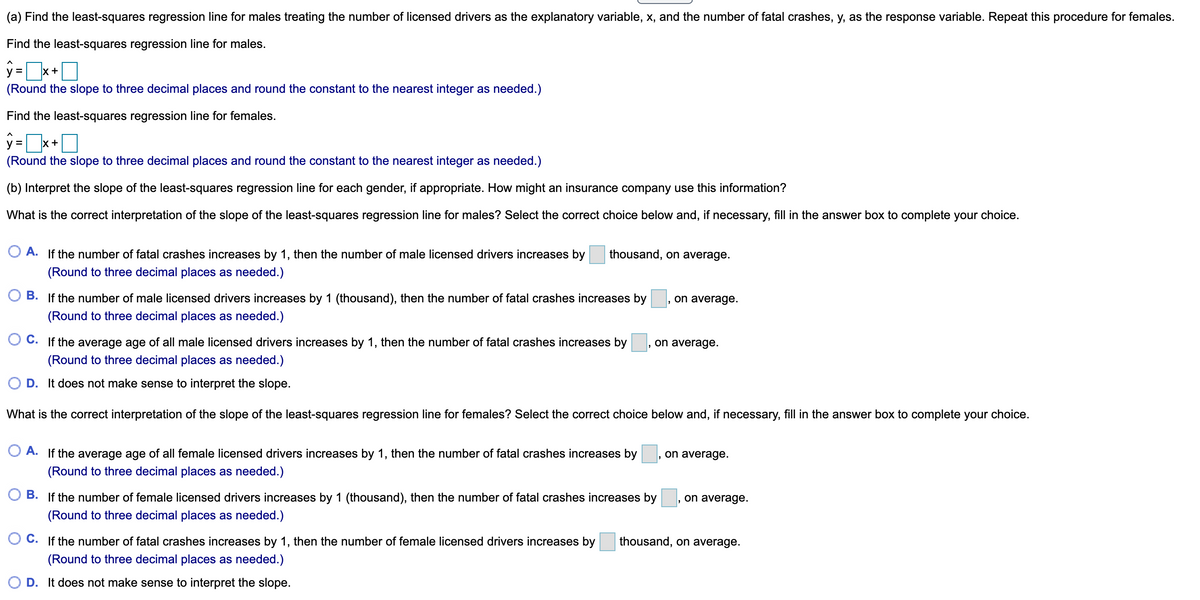
Transcribed Image Text:(a) Find the least-squares regression line for males treating the number of licensed drivers as the explanatory variable, x, and the number of fatal crashes, y, as the response variable. Repeat this procedure for females.
Find the least-squares regression line for males.
X+
(Round the slope to three decimal places and round the constant to the nearest integer as needed.)
Find the least-squares regression line for females.
y =
x +
(Round the slope to three decimal places and round the constant to the nearest integer as needed.)
(b) Interpret the slope of the least-squares regression line for each gender, if appropriate. How might an insurance company use this information?
What is the correct interpretation of the slope of the least-squares regression line for males? Select the correct choice below and, if necessary, fill in the answer box to complete your choice.
O A. If the number of fatal crashes increases by 1, then the number of male licensed drivers increases by
thousand, on average.
(Round to three decimal places as needed.)
B. If the number of male licensed drivers increases by 1 (thousand), then the number of fatal crashes increases by
, on average.
(Round to three decimal places as needed.)
O C. If the average age of all male licensed drivers increases by 1, then the number of fatal crashes increases by
on average.
(Round to three decimal places as needed.)
D. It does not make sense to interpret the slope.
What is the correct interpretation of the slope of the least-squares regression line for females? Select the correct choice below and, if necessary, fill in the answer box to complete your choice.
A. If the average age of all female licensed drivers increases by 1, then the number of fatal crashes increases by
on average.
(Round to three decimal places as needed.)
B. If the number of female licensed drivers increases by 1 (thousand), then the number of fatal crashes increases by
on average.
(Round to three decimal places as needed.)
O C. If the number of fatal crashes increases by 1, then the number of female licensed drivers increases by
thousand, on average.
(Round to three decimal places as needed.)
O D. It does not make sense to interpret the slope.
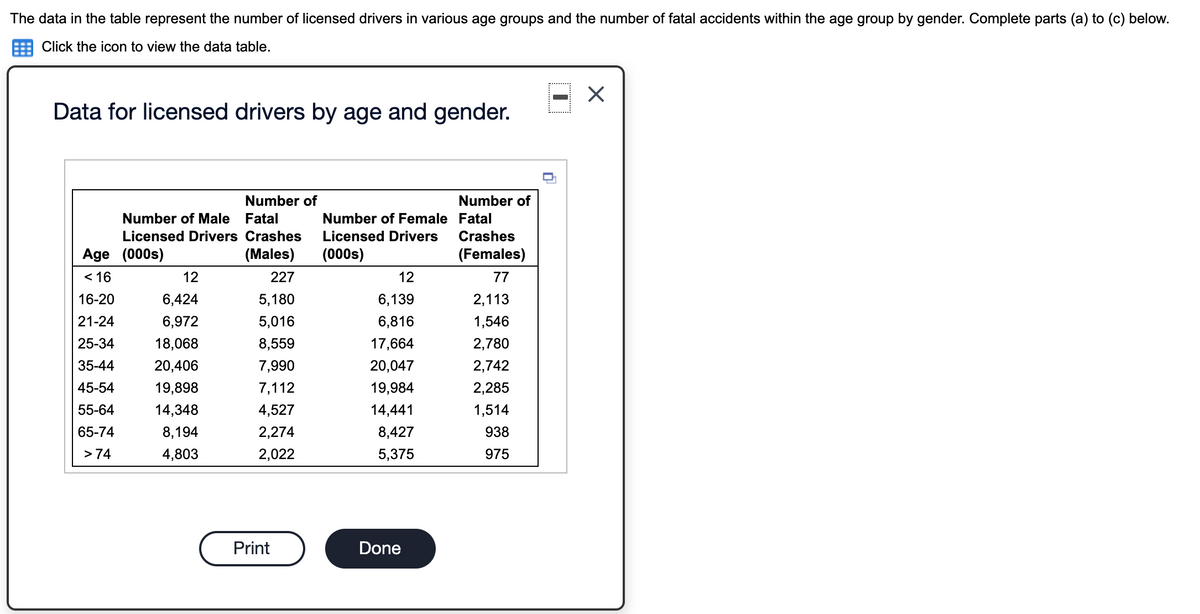
Transcribed Image Text:The data in the table represent the number of licensed drivers in various age groups and the number of fatal accidents within the age group by gender. Complete parts (a) to (c) below.
Click the icon to view the data table.
Data for licensed drivers by age and gender.
Number of
Number of
Number of Male Fatal
Number of Female Fatal
Licensed Drivers Crashes
Licensed Drivers
Crashes
Age (000s)
(Males)
(000s)
(Females)
< 16
12
227
12
77
16-20
6,424
5,180
6,139
2,113
21-24
6,972
5,016
6,816
1,546
25-34
18,068
8,559
17,664
2,780
35-44
20,406
7,990
20,047
2,742
45-54
19,898
7,112
19,984
2,285
55-64
14,348
4,527
14,441
1,514
65-74
8,194
2,274
8,427
938
> 74
4,803
2,022
5,375
975
Print
Done
Expert Solution
This question has been solved!
Explore an expertly crafted, step-by-step solution for a thorough understanding of key concepts.

This is a popular solution!

Includes step-by-step video

Trending now
This is a popular solution!

Learn your way
Includes step-by-step video

Step by step
Solved in 3 steps with 4 images

Recommended textbooks for you
Glencoe Algebra 1, Student Edition, 9780079039897…
Algebra
ISBN:
9780079039897
Author:
Carter
Publisher:
McGraw Hill

Holt Mcdougal Larson Pre-algebra: Student Edition…
Algebra
ISBN:
9780547587776
Author:
HOLT MCDOUGAL
Publisher:
HOLT MCDOUGAL

Functions and Change: A Modeling Approach to Coll…
Algebra
ISBN:
9781337111348
Author:
Bruce Crauder, Benny Evans, Alan Noell
Publisher:
Cengage Learning
Glencoe Algebra 1, Student Edition, 9780079039897…
Algebra
ISBN:
9780079039897
Author:
Carter
Publisher:
McGraw Hill
Holt Mcdougal Larson Pre-algebra: Student Edition…
Algebra
ISBN:
9780547587776
Author:
HOLT MCDOUGAL
Publisher:
HOLT MCDOUGAL
Functions and Change: A Modeling Approach to Coll…
Algebra
ISBN:
9781337111348
Author:
Bruce Crauder, Benny Evans, Alan Noell
Publisher:
Cengage Learning

Algebra: Structure And Method, Book 1
Algebra
ISBN:
9780395977224
Author:
Richard G. Brown, Mary P. Dolciani, Robert H. Sorgenfrey, William L. Cole
Publisher:
McDougal Littell