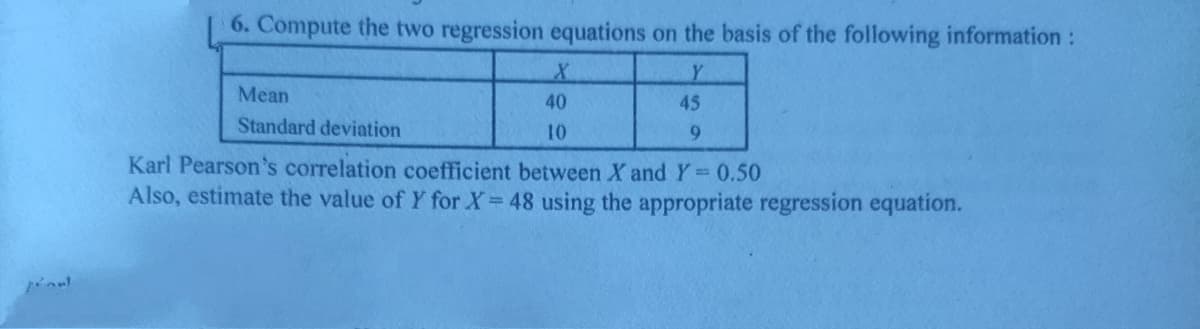
6. Compute the two regression equations on the basis of the following information: Mean 40 45 Standard deviation 10 9. Karl Pearson's correlation coefficient between X and Y 0.50 Also, estimate the value of Y for X 48 using the appropriate regression equation.


Q: he following data shows the dexterity test scores of five assembly-line employees of Dimples Company…
A: Since you have asked multiple questions, we will solve the first question for you. If you want any…
Q: 16. Find the regression coefficient of y on x from the following regression equations. 5x 22+y 64 x…
A:
Q: 20. For the following data: a. Find the regression equation for predicting Y from X. b. Calculate…
A: Given, n=6. Calculation: X Y X2 Y2 XY 3 3 9 9 9 6 9 36 81 54 5 8 25 64 40 4 3…
Q: 1. !--- Which of the following assumptions is not needed for 3 to be an unbiased estimate of the…
A: Regression model: This statistical technique is used frequently in predictive statistics. It depicts…
Q: 5. Find regression line to the following data. 4 5 3.2 5.6 9.3 14. 21.9 Y 24 21 2.1 Also find the…
A:
Q: 1.4. If the following observations of X5 were taken, show which values will now be used in the…
A: 1.4) If the following observations of X5 were taken, we need to show which values will be used in…
Q: In a partially destroyed laboratory record of an analysis of correlation data, the following results…
A:
Q: 1) Indicate whether the following statements are true or false. Explain why and show your work. c)…
A: given In the regression Y= B1+ B2X + B3Z+u if there is a strong linear correlation between X and…
Q: Since the value of the b1 regression coefficient is 6.032 and the standard error value of this…
A: Given b1= 6.032 Standard error = 2.428
Q: 4. The following data represents the number of days absent, x, and the final grade, y, for a sample…
A: (a) Use EXCEL to obtain the value correlation coefficient r: EXCEL procedure: Go to EXCEL Go…
Q: 40. Two regression lines of a sample are X+6Y=6 and 3X+2Y 0. Find the correlation coefficient.
A:
Q: 4.For a sample of 12 observations, a businessman wants to regress the price (in dollar) of the…
A:
Q: Q1. Consider the following data: 4 5 2 3 4 5 4 Find out the following: (i) (ii) Karl Pearson…
A: x y x-x y-y (x-x)(y-y) (x-x)2 (y-y)2 4 6 0 1 0 0 1 6 4 2 -1 -2 4 1 5 5 1 0 0 1 0 2 4 -2 -1 2…
Q: The following data, based on 450 students, are given for marks in Statistics and Economics at a…
A: Let X be the marks in Statistics Y be the marks in economics.
Q: Consider the following population regression model: Yi = Bo + B1D1i + B2Dzi + B3(D1¡D21) + uj,…
A: Given: the following population regression model: Y;= Bo + B1D1i +B2D2i+ B3(D1iP2i) + uj,, i = 1,…
Q: Select a letter from the choices on the right into each of the drop-down boxes on the left.…
A: Given that ; Here we use statistical concept to identify the symbols.
Q: Assume that variables xx and yy have a significant correlation, and that the line of best fit has…
A: Given , The variables x and y have a significant correlation. The line of best fit is, ( Use…
Q: Suppose the simple linear regression model, Y; = Bo + B1 x; + E;, is used to explain the…
A:
Q: By using the following data, find out the two lines of regression and from them com- pute the Karl…
A:
Q: Q1. Consider the following data: 4 6. 5 3 y 6 4 5 4 Find out the following: (i) (ii) Karl Pearson…
A: x y x2 y2 (x-x) (x-x)2 (y-y) (y-y)2 xy 4 6 8 12 0 0 0.8 1.6 24 6 5 12 10 0.8 1.6 5 10 30 5 5…
Q: Given the following data: 3 4. 8 2. 10 15 8 9. 6. 11 15 Obtain the two regression equations and…
A: Given data is x 5 3 7 4 8 2 10 6 8 7 9 15 y 8 6 8 5 9 6 8 5 11 7 8 15
Q: 1. Formulate the regression equation for the data. 2. What would be the likely blood pressure…
A: The question is about regression Given :
Q: Consider the following data: Q1. x 46 5 23 y 64 546 Find out the following: (i) Karl Pearson…
A: x y xy x2 y2 4 6 24 16 36 6 4 24 36 16 5 5 25 25 25 2 4 8 4 16 3 6 18 9 36…
Q: Compute the two regression equations on the basis of the following information : Y Mean 40 45…
A:
Q: The following estimated regression equation is based on 30 observations. ŷ = 17.1 + 4x1 – 2.12 +…
A: Given that: sample size n=30 SST=1804 SSR=1761
Q: Ten observations were provided for a dependent variable y and two independent variables x1 and x2;…
A: From the given information, the value of SST is 15189.8 and the value of SSR is 14056.9.
Q: Find the regression coefficient of y on x from the following regression equations. 5x 22 +y 64 x 24+…
A:
Q: 5) The ages (X) of ten second-hand cars and their km values (Y) are given below. a) Calculate the…
A: Solution: n= 7 observation x y xy x^2 y^2 4.8 45 216 23.04 2025 2.5 26 65 6.25 676 5.5 50…
Q: Suppose the simple linear regression model, Y; = Bo + B1 xi + E;, is used to explain the…
A: Simple linear regression model is given by yi=β0 + β1 xi+εi The simple linear regression model is…
Q: In which of the following cases is an instrumental variable not used to obtain a consistent…
A: 1. It is not used when there is correlation between regressors.(B) Instrumental variable methods…
Q: The following table gives the data for the average temperature and the snow accumulation in several…
A: Use the Excel and Perform the Regression. Followings are the Steps to perform the Regression 1) Open…
Q: The following data on price (8) and the overall score for 6 stereo headphones that were tested by…
A: Given First enter this data into ExcelNow,
Q: The ages (X) of ten second-hand cars and their km values (Y) are given below. a) Calculate the…
A: Data given X: 3.3, 5.8,3,4.5,1.8,3.9,2 Y:35,60,21,55,34,45,2
Q: 7. Given No. of pairs = 12 X Y AΜ 74.50 125.50 Std. Deviation 13.07 15.85 Summation of products of…
A: The correlation coefficient is used to measure the linear relation between two variables. The…
Q: The following estimated regression equation based on 10 observations was presented. ŷ = 28.1270 +…
A: It is been asked to find the point estimate for mean and individual value of y for the provided…
Q: Which of the following statements is NOT true? a.If the correlation coefficent, rr, is negative,…
A: Answer : option d Explanation: Option d is not true as non-zero r doesn't mean a significant…
Q: Write the regression equation that represents the above equation. Y = 9.804326378 + 0.65795*X1 +…
A: The F test is used to test whether the regression model is effective or not. In this test the null…
Q: The data is given as follow. xi 2 6 9 13 20 Vi 7 18 9 26 23 The estimated regression equation for…
A: The given regression equation is y-hat = 7.6 + 0.9 x.Required calculations for finding SSE, SST and…
Q: 12) Use computer software to find the best multiple regression equation to explain the variation in…
A:
Q: Q2. Given that the means of X and Y are 65 and 67, their standard deviations are 2.5 and 3.5…
A:
Q: 1) A sample of fast food menu items is taken and the item's sodium and calories are reported. Sodium…
A: a) Sodium(mg) Calories 350 160 970 300 590 290 250 160 635 180 520 240 800 320…
Q: 1. A simple random sample of golfers provides the following statistics: No. of hours of playing per…
A: In multiple linear regression, there will be more than one independent variable. In simple linear…
Q: Find out the regression coefficients of Y on X and X on Y from the following data: ΣΧ= 50, X= 5 , Σ…
A: It is given that variance of X is 4 and the variance of Y is 9.
Q: en observations were provided for a dependent variable y and two independent variables x1 and x2;…
A:
Q: You are given the following data : 85 А. Мean Standard Deviat. 11 36 8 Correlation coefficient…
A:
Q: Suppose you have a regression model with 2 independent variables and 85 observations. Considering…
A: Given Information : Number of independent variable, k = 2. Number of observation = 85. Significance…
Q: 9. A set of n = 50 pairs of X and Y scores has SSX = 180, SSY = 80, and SP = 30 . What is the…
A: Since you have asked multiple questions, we will solve the first question for you .If you want a…
Q: 6, Given are five observations collected in a regression study on two variables. 2. 13 20 19 8. 27…
A: Given observation and Calculation x y x2 y2 xy 2 7 4 49 14 6 19 36 361 114 9 8 81 64 72…
Q: Consider the following competing hypotheses: H0: ρxy = 0 HA: ρxy ≠ 0 The sample consists of 27…
A: Thanks for giving opportunity to serve for bartleby students, Hey, There ! Thank you for posting…
Q: 12. Which of the following statistic in the Multiple Regression Analysis SPSS output shows the…
A: The regression analysis is a statistical procedure that allows us to find the linear association…


Trending now
This is a popular solution!

Step by step
Solved in 2 steps

- Olympic Pole Vault The graph in Figure 7 indicates that in recent years the winning Olympic men’s pole vault height has fallen below the value predicted by the regression line in Example 2. This might have occurred because when the pole vault was a new event there was much room for improvement in vaulters’ performances, whereas now even the best training can produce only incremental advances. Let’s see whether concentrating on more recent results gives a better predictor of future records. (a) Use the data in Table 2 (page 176) to complete the table of winning pole vault heights shown in the margin. (Note that we are using x=0 to correspond to the year 1972, where this restricted data set begins.) (b) Find the regression line for the data in part ‚(a). (c) Plot the data and the regression line on the same axes. Does the regression line seem to provide a good model for the data? (d) What does the regression line predict as the winning pole vault height for the 2012 Olympics? Compare this predicted value to the actual 2012 winning height of 5.97 m, as described on page 177. Has this new regression line provided a better prediction than the line in Example 2?If a sample of 25 pairs of data yields a correlation coefficient, r, of 0.390 and the scatterplot displays a linear trend, can you use the regression equation to make predictions, assuming your x-values are within the domain of the data set? Choose your answer from the multiple choice answers below A.) Yes, because rcrit = 0.396 and the regression coefficient, r, is less than this value. B.) Yes, because rcrit = 0.381 and the regression coefficient, r, is greater than this value. C.) No, because rcrit = 0.381 and the regression coefficient, r, is greater than this value. D.) No, because rcrit = 0.396 and the regression coefficient, r, is less than this value.If other factors are held constant and the Pearson correlation value between X and Y is r = 0.80, then the regression equation will tend to produce more accurate predictions than would be obtained if the Pearson correlation value was r = 0.60. Group of answer choices True False
- Consider the following regression equation specied for 2-period panel data: where i = 1; 2; :::N and t = 1; 2. If you expect that β_1 is positive, but the correlation between Δx_i and Δu_i is negative, thenwhat is the bias in the OLS estimator of β_1 in the first-differenced equation?Jimmy tested a sample with of n=4 pairs of X and Y scores and found SSY = 48 and a Pearson correlation between X and Y of r = 0.4 Calculate whether the Fobserved in this regression experiment is significant at the ∞ = o.01 levelConsider the following sample regression equation yˆ = 150 − 20x, where y is the demand for Product A (in 1,000s) and x is the price of the product (in $). The slope coefficient indicates that if _____
- 1) Indicate whether the following statements are true or false. Explain why and show your work. c) In the regression Y= B1+ B2X + B3Z+u , if there is a strong linear correlation between X and Z, then it is more likely you fail to reject the null hypotheses that individual slope parameters are insignificant.(1) Write out the regression equation (2) What is the sample size used in this investigation? (3) Determine the values of *, ** and ***, ****A set of n = 15 pairs of X and Y values has a correlation of r = +0.80 with SSY = 75, and the regression equation for predicting Y is computed. Find the standard error of estimate for the regression equation. How big would the standard error be if the sample size were n = 30.
- If other factors are held constant and the Pearson correlation value between X and Y is r = 0.80, then the regression equation will tend to produce more accurate predictions than would be obtained if the Pearson correlation value was r = 0.60. True or FalseThe following data shows the dexterity test scores of five assembly-line employees of Dimples Company Limited and their respective hourly productivity.Employee Score on dexterity test (?) Ali 12Kofi 14Kwesi 17Abudu 16Nana 11Units produced in an hour (?) 55636770 51You are required to(i) Write the regression equation(ii) Interpret the regression equation(iii) Calculate the Pearson’s Product Moment Correlation Coefficient.(iv) Interpret the correlation coefficient (v) Suppose the dexterity test score is 13, what would be the units produced in an hour? (vi) Clearly explain (in detail) the difference between regression analysis and correlation analysis.2. The following data, adapted from Montgomery, Peck, and Vining (2001), present the number of certified mental defectives per 10,000 of estimated population in the United Kingdom ( y) and the number of radio receiver licenses issued (x) by the BBC (in millions) for the years 1924 through 1937. Fit a regression model relating y and x. Comment on the model. Specifically, does the existence of a strong correlation imply a cause-and-effect relationship?
