Refer to the following scenario. A government official is in charge of allocating social programs throughout the city of Vancouver. He will decide where these social outreach programs should be located based on the percentage of residents living below the poverty line in each region of the city. He takes a simple random sample of 130 people living in Gastown and finds that 21 have an annual income that is below the poverty line. For each of the following statements, specify whether the statement is a correct interpretation of the 95% confidence interval for the true proportion of Gastown residents living below the poverty line. A. 16.15% (21/130) of Gastown residents are living below the poverty line. true B. There is a 95% probability that the true proportion of Gastown residents who are living below the poverty line equals 21/130. true C. If another random sample of 130 Gastown residents is drawn, there is a 95% probability that the sample proportion of Gastown residents who are living below the poverty line equals 21/130. false v D. If many random samples of 130 Gastown residents are drawn, 95% of the resulting confidence intervals will contain the value of the true proportion of Gastown residents who are living below the poverty line. false v E. If many random samples of 130 Gastown residents are drawn, 95% of the resulting confidence intervals will contain the value 21/130. true
Refer to the following scenario. A government official is in charge of allocating social programs throughout the city of Vancouver. He will decide where these social outreach programs should be located based on the percentage of residents living below the poverty line in each region of the city. He takes a simple random sample of 130 people living in Gastown and finds that 21 have an annual income that is below the poverty line. For each of the following statements, specify whether the statement is a correct interpretation of the 95% confidence interval for the true proportion of Gastown residents living below the poverty line. A. 16.15% (21/130) of Gastown residents are living below the poverty line. true B. There is a 95% probability that the true proportion of Gastown residents who are living below the poverty line equals 21/130. true C. If another random sample of 130 Gastown residents is drawn, there is a 95% probability that the sample proportion of Gastown residents who are living below the poverty line equals 21/130. false v D. If many random samples of 130 Gastown residents are drawn, 95% of the resulting confidence intervals will contain the value of the true proportion of Gastown residents who are living below the poverty line. false v E. If many random samples of 130 Gastown residents are drawn, 95% of the resulting confidence intervals will contain the value 21/130. true

MATLAB: An Introduction with Applications
6th Edition
ISBN:9781119256830
Author:Amos Gilat
Publisher:Amos Gilat
Chapter1: Starting With Matlab
Section: Chapter Questions
Problem 1P

Related questions
Question
Please see below. I need help with this. True and false.
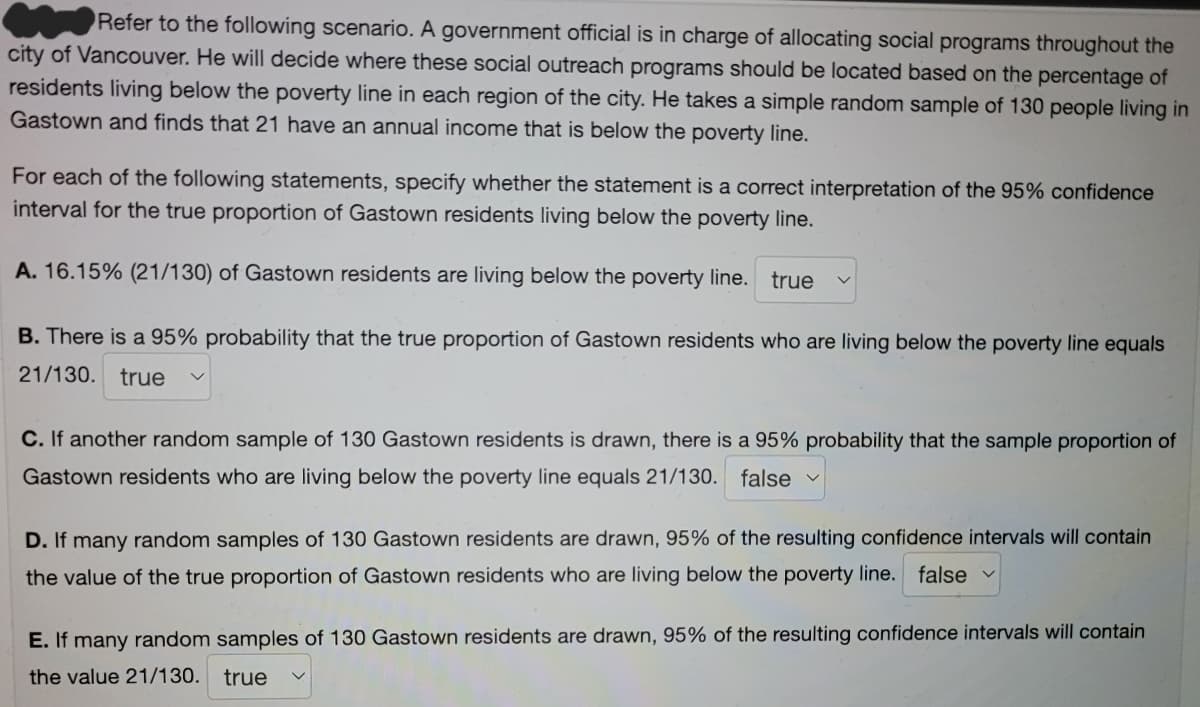
Transcribed Image Text:Refer to the following scenario. A government official is in charge of allocating social programs throughout the
city of Vancouver. He will decide where these social outreach programs should be located based on the percentage of
residents living below the poverty line in each region of the city. He takes a simple random sample of 130 people living in
Gastown and finds that 21 have an annual income that is below the poverty line.
For each of the following statements, specify whether the statement is a correct interpretation of the 95% confidence
interval for the true proportion of Gastown residents living below the poverty line.
A. 16.15% (21/130) of Gastown residents are living below the poverty line. true
B. There is a 95% probability that the true proportion of Gastown residents who are living below the poverty line equals
21/130. true
C. If another random sample of 130 Gastown residents is drawn, there is a 95% probability that the sample proportion of
Gastown residents who are living below the poverty line equals 21/130. false
D. If many random samples of 130 Gastown residents are drawn, 95% of the resulting confidence intervals will contain
the value of the true proportion of Gastown residents who are living below the poverty line. false
E. If many random samples of 130 Gastown residents are drawn, 95% of the resulting confidence intervals will contain
the value 21/130.
true
Expert Solution
This question has been solved!
Explore an expertly crafted, step-by-step solution for a thorough understanding of key concepts.

This is a popular solution!

Trending now
This is a popular solution!

Step by step
Solved in 2 steps with 2 images

Recommended textbooks for you
MATLAB: An Introduction with Applications
Statistics
ISBN:
9781119256830
Author:
Amos Gilat
Publisher:
John Wiley & Sons Inc

Probability and Statistics for Engineering and th…
Statistics
ISBN:
9781305251809
Author:
Jay L. Devore
Publisher:
Cengage Learning

Statistics for The Behavioral Sciences (MindTap C…
Statistics
ISBN:
9781305504912
Author:
Frederick J Gravetter, Larry B. Wallnau
Publisher:
Cengage Learning
MATLAB: An Introduction with Applications
Statistics
ISBN:
9781119256830
Author:
Amos Gilat
Publisher:
John Wiley & Sons Inc
Probability and Statistics for Engineering and th…
Statistics
ISBN:
9781305251809
Author:
Jay L. Devore
Publisher:
Cengage Learning
Statistics for The Behavioral Sciences (MindTap C…
Statistics
ISBN:
9781305504912
Author:
Frederick J Gravetter, Larry B. Wallnau
Publisher:
Cengage Learning

Elementary Statistics: Picturing the World (7th E…
Statistics
ISBN:
9780134683416
Author:
Ron Larson, Betsy Farber
Publisher:
PEARSON

The Basic Practice of Statistics
Statistics
ISBN:
9781319042578
Author:
David S. Moore, William I. Notz, Michael A. Fligner
Publisher:
W. H. Freeman

Introduction to the Practice of Statistics
Statistics
ISBN:
9781319013387
Author:
David S. Moore, George P. McCabe, Bruce A. Craig
Publisher:
W. H. Freeman