1. By predicting fertility and divorce rates as well as life-styles economic, demographers attempt to forecast the economy during the next decade and beyond -- predicting which industries will flourish and which will falter. The following table gives a distribution of age groups in the U.S. for the year 2030. Age Group Relative Age Group Relative frequency frequency 0-9.5 0.12 49.5-59.5 0.12 9.5-19.5 59.5-69.5 0.08 19.5-29.5 69.5-79.5 0.06 29.5-39.5 79.5-89.5 0.03 39.5-49.5 0.16 c) What proportion of Americans are expected to be from 19.5 years to 39.5 years? 0.14 k 0.16
1. By predicting fertility and divorce rates as well as life-styles economic, demographers attempt to forecast the economy during the next decade and beyond -- predicting which industries will flourish and which will falter. The following table gives a distribution of age groups in the U.S. for the year 2030. Age Group Relative Age Group Relative frequency frequency 0-9.5 0.12 49.5-59.5 0.12 9.5-19.5 59.5-69.5 0.08 19.5-29.5 69.5-79.5 0.06 29.5-39.5 79.5-89.5 0.03 39.5-49.5 0.16 c) What proportion of Americans are expected to be from 19.5 years to 39.5 years? 0.14 k 0.16

Glencoe Algebra 1, Student Edition, 9780079039897, 0079039898, 2018
18th Edition
ISBN:9780079039897
Author:Carter
Publisher:Carter
Chapter10: Statistics
Section10.6: Summarizing Categorical Data
Problem 4AGP

Related questions
Question
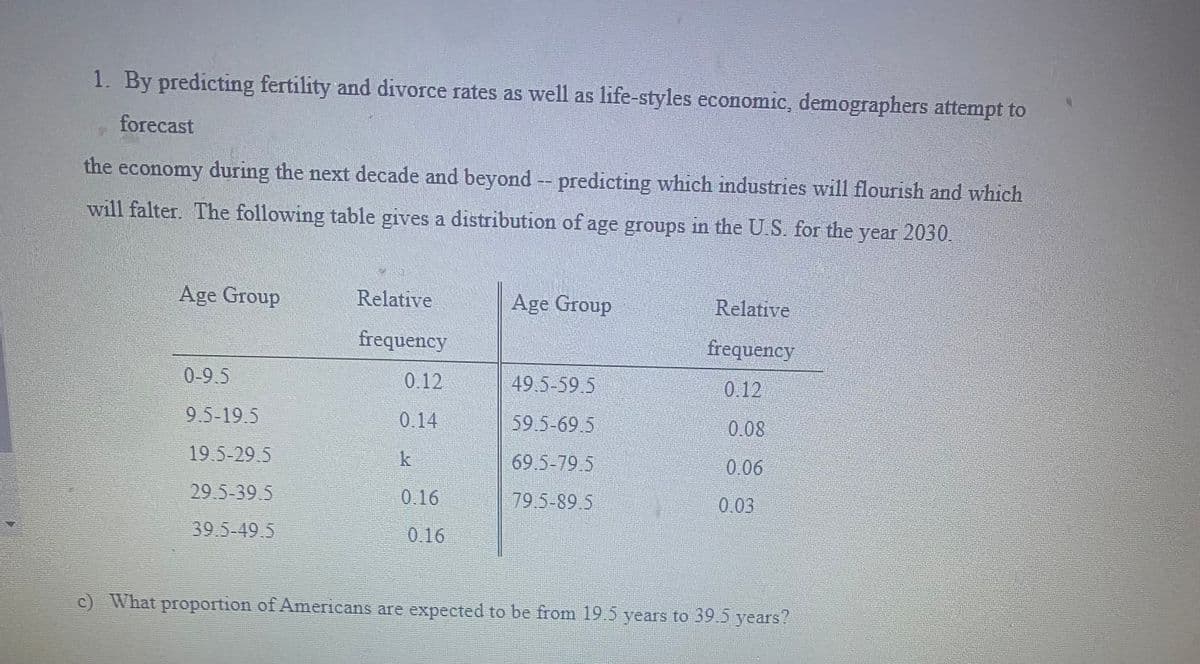
Transcribed Image Text:1. By predicting fertility and divorce rates as well as life-styles economic, demographers attempt to
forecast
the economy during the next decade and beyond -- predicting which industries will flourish and which
will falter. The following table gives a distribution of age groups in the U.S. for the year 2030.
Age Group
Relative
Age Group
Relative
frequency
frequency
0-9.5
0.12
49.5-59.5
0.12
9.5-19.5
59.5-69.5
0.08
19.5-29.5
69.5-79.5
0.06
29.5-39.5
79.5-89.5
0.03
39.5-49 5
0.16
c) What proportion of Americans are expected to be from 19.5 years to 39.5 years?
k
0.16
Expert Solution
This question has been solved!
Explore an expertly crafted, step-by-step solution for a thorough understanding of key concepts.

Step by step
Solved in 2 steps

Recommended textbooks for you
Glencoe Algebra 1, Student Edition, 9780079039897…
Algebra
ISBN:
9780079039897
Author:
Carter
Publisher:
McGraw Hill
Glencoe Algebra 1, Student Edition, 9780079039897…
Algebra
ISBN:
9780079039897
Author:
Carter
Publisher:
McGraw Hill