The population standard deviation for the annual incomes of childcare workers in Texas and in Indiana are estimated as 6200 and 6500, respectively. It is also known that both populations are approximately normally distributed. At the 0.01 level of significance, is there sufficient evidence to support the claim that the mean annual income, H₁, of childcare workers in Texas is less than the mean annual income, μ₂, of childcare workers in Indiana? Perform a one-tailed test. Then complete the parts below. Carry your intermediate computations to at least three decimal places. (If necessary, consult a list of formulas.) (a) State the null hypothesis Ho and the alternative hypothesis H₁. H O Р S P HO H₁:0 00 (b) Determine the type of test statistic to use. (Choose one) ▼ 0=0 OSO 020 (c) Find the value of the test statistic. (Round to three or more decimal places.) 00 >O ? (d) Find the p-value. (Round to three or more decimal places.) 0 (e) Can we support the claim that the mean annual income of childcare workers in Texas is less than the mean annual incom of childcare workers in Indiana? Yes No + 7 O
The population standard deviation for the annual incomes of childcare workers in Texas and in Indiana are estimated as 6200 and 6500, respectively. It is also known that both populations are approximately normally distributed. At the 0.01 level of significance, is there sufficient evidence to support the claim that the mean annual income, H₁, of childcare workers in Texas is less than the mean annual income, μ₂, of childcare workers in Indiana? Perform a one-tailed test. Then complete the parts below. Carry your intermediate computations to at least three decimal places. (If necessary, consult a list of formulas.) (a) State the null hypothesis Ho and the alternative hypothesis H₁. H O Р S P HO H₁:0 00 (b) Determine the type of test statistic to use. (Choose one) ▼ 0=0 OSO 020 (c) Find the value of the test statistic. (Round to three or more decimal places.) 00 >O ? (d) Find the p-value. (Round to three or more decimal places.) 0 (e) Can we support the claim that the mean annual income of childcare workers in Texas is less than the mean annual incom of childcare workers in Indiana? Yes No + 7 O

Glencoe Algebra 1, Student Edition, 9780079039897, 0079039898, 2018
18th Edition
ISBN:9780079039897
Author:Carter
Publisher:Carter
Chapter10: Statistics
Section10.6: Summarizing Categorical Data
Problem 10CYU

Related questions
Question
How to solve please show step by step
Transcribed Image Text:Español
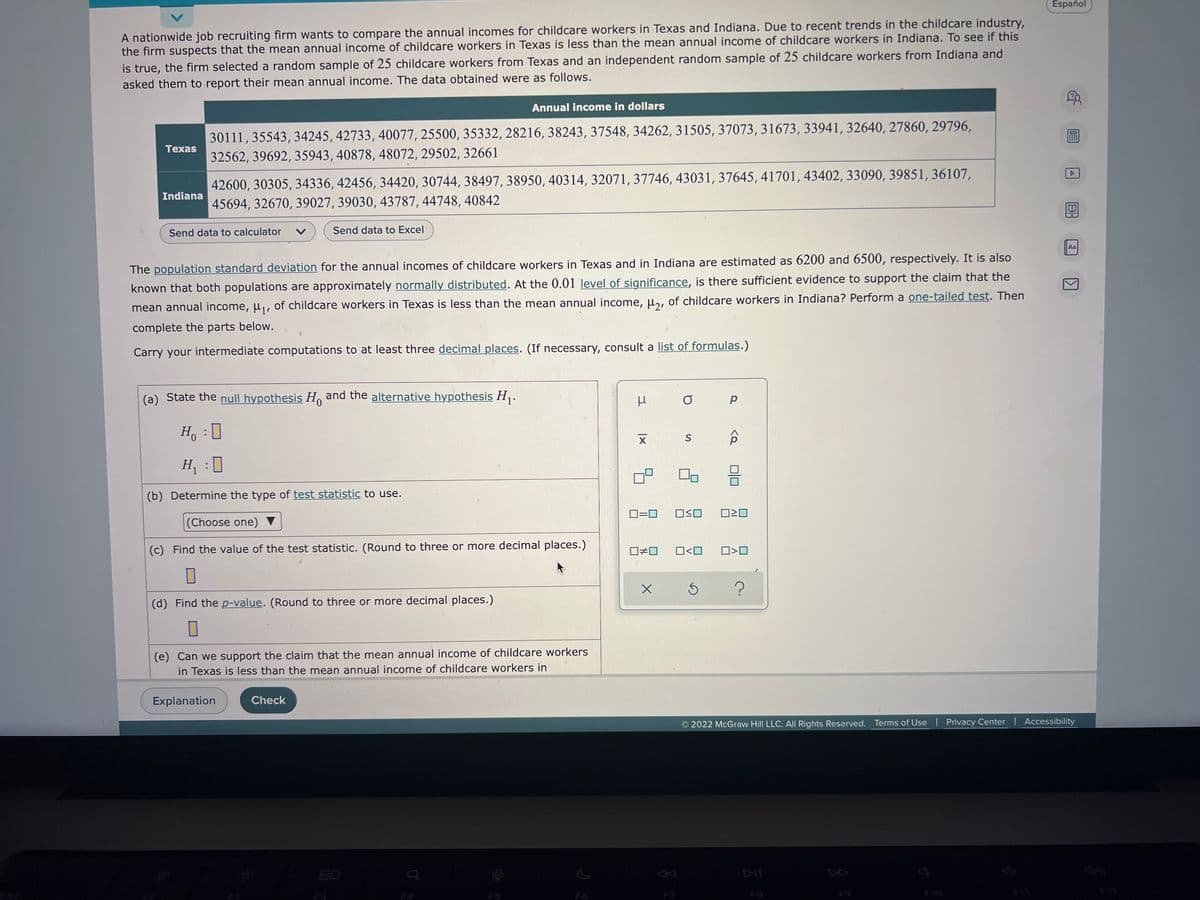
A nationwide job recruiting firm wants to compare the annual incomes for childcare workers in Texas and Indiana. Due to recent trends in the childcare industry,
the firm suspects that the mean annual income of childcare workers in Texas is less than the mean annual income of childcare workers in Indiana. To see if this
is true, the firm selected a random sample of 25 childcare workers from Texas and an independent random sample of 25 childcare workers from Indiana and
asked them to report their mean annual income. The data obtained were as follows.
Annual income in dollars
Texas
30111, 35543, 34245, 42733, 40077, 25500, 35332, 28216, 38243, 37548, 34262, 31505, 37073, 31673, 33941, 32640, 27860, 29796,
32562, 39692, 35943, 40878, 48072, 29502, 32661
Indiana
42600, 30305, 34336, 42456, 34420, 30744, 38497, 38950, 40314, 32071, 37746, 43031, 37645, 41701, 43402, 33090, 39851, 36107,
45694, 32670, 39027, 39030, 43787, 44748, 40842
Send data to calculator V
Send data to Excel
Aa
The population standard deviation for the annual incomes of childcare workers in Texas and in Indiana are estimated as 6200 and 6500, respectively. It is also
known that both populations are approximately normally distributed. At the 0.01 level of significance, is there sufficient evidence to support the claim that the
mean annual income, μ₁, of childcare workers in Texas is less than the mean annual income, μ2, of childcare workers in Indiana? Perform a one-tailed test. Then
complete the parts below.
Carry your intermediate computations to at least three decimal places. (If necessary, consult a list of formulas.)
(a) State the null hypothesis Ho and the alternative hypothesis H₁.
O
р
S
Ho
H₁ :0
(b) Determine the type of test statistic to use.
0=0 ☐≤O 0²0
(Choose one) ▼
(c) Find the value of the test statistic. (Round to three or more decimal places.)
☐#0 0<0 ☐>O
X
Ś
(d) Find the p-value. (Round to three or more decimal places.)
0
(e) Can we support the claim that the mean annual income of childcare workers
in Texas is less than the mean annual income of childcare workers in
Explanation
Check
© 2022 McGraw Hill LLC. All Rights Reserved. Terms of Use | Privacy Center | Accessibility
$10
3
|x
X
<Q
n
A

Transcribed Image Text:20
The population standard deviation for the annual incomes of childcare workers in Texas and in Indiana are estimated as 6200 and 6500, respectively. It is also
known that both populations are approximately normally distributed. At the 0.01 level of significance, is there sufficient evidence to support the claim that the
mean annual income, μ₁, of childcare workers in Texas is less than the mean annual income, μ₂, of childcare workers in Indiana? Perform a one-tailed test. Then
complete the parts below.
Carry your intermediate computations to at least three decimal places. (If necessary, consult a list of formulas.)
(a) State the null hypothesis Ho and the alternative hypothesis H₁.
O
Р
Aa
Ho
:
S
H₁ :0
(b) Determine the type of test statistic to use.
OSO
020
(Choose one)
(c) Find the value of the test statistic. (Round to three or more decimal places.)
0<0 0>0
0
Ś
?
(d) Find the p-value. (Round to three or more decimal places.)
0
(e) Can we support the claim that the mean annual income of childcare workers
in Texas is less than the mean annual income of childcare workers in
Indiana?
Yes No
2022 McGraw Hill LLC. All Rights Reserved. Terms of Use | Privacy Center | Accessibility
Explanation
Check
3
XI
0#0
X
<Q
DE
18-
Expert Solution
This question has been solved!
Explore an expertly crafted, step-by-step solution for a thorough understanding of key concepts.

Step by step
Solved in 3 steps

Recommended textbooks for you
Glencoe Algebra 1, Student Edition, 9780079039897…
Algebra
ISBN:
9780079039897
Author:
Carter
Publisher:
McGraw Hill

Holt Mcdougal Larson Pre-algebra: Student Edition…
Algebra
ISBN:
9780547587776
Author:
HOLT MCDOUGAL
Publisher:
HOLT MCDOUGAL

Glencoe Algebra 1, Student Edition, 9780079039897…
Algebra
ISBN:
9780079039897
Author:
Carter
Publisher:
McGraw Hill
Holt Mcdougal Larson Pre-algebra: Student Edition…
Algebra
ISBN:
9780547587776
Author:
HOLT MCDOUGAL
Publisher:
HOLT MCDOUGAL


College Algebra (MindTap Course List)
Algebra
ISBN:
9781305652231
Author:
R. David Gustafson, Jeff Hughes
Publisher:
Cengage Learning