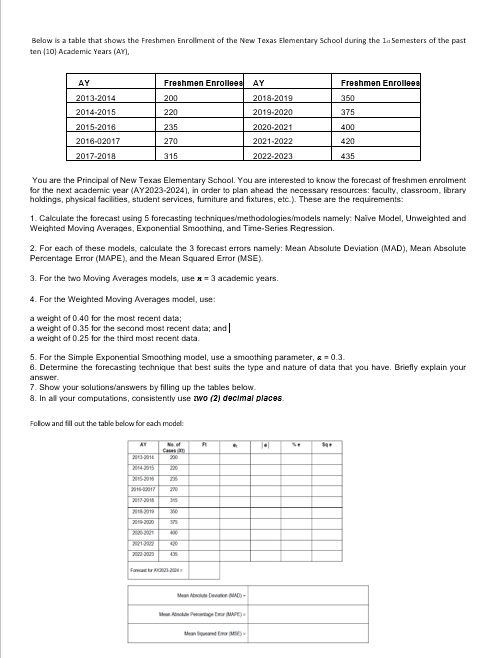
1. Calculate the forecast using 5 forecasting techniques/methodologies/models namely: Naive Model, Unweighted and Weighted Moving Averages, Exponential Smoothing, and Time-Series Regression. 2. For each of these models, calculate the 3 forecast errors namely: Mean Absolute Deviation (MAD), Mean Absolute Percentage Error (MAPE), and the Mean Squared Error (MSE). 3. For the two Moving Averages models, use x3 academic years. 4. For the Weighted Moving Averages model, use: a weight of 0.40 for the most recent data; a weight of 0.35 for the second most recent data; and a weight of 0.25 for the third most recent data. 5. For the Simple Exponential Smoothing model, use a smoothing parameter, a=0.3. 6. Determine the forecasting technique that best suits the type and nature of data that you have. Briefly explain your answer. 7. Show your solutions/answers by filling up the tables below. 8. In all your computations, consistently use zwo (2) decimal places. Follow and fill out the table below for each model: CHAD 200 A


Q: If the decedent owned property in other states, a separate, __________ probate might have to be…
A: Ancillary probate administration is a legal procedure that allows the overseas personal…
Q: What are the top 10 risks of IT project management
A: Here, I would explain the top ten risks applicable to IT project management, An IT project often…
Q: Describe two typical problems that may occur while deploying a prescriptive process model. For each…
A: Two typical problems that may occur while deploying a prescriptive process model are:…
Q: A 9 percent preferrred stock for Micky's Corp. is currently selling for $75 a share. What is the…
A: The cost of preferred stock is the price which company pays to the stockholder in the return of the…
Q: Mf2. Where can the digital pricing tool be found? DNA BlockWorks Work Center At the…
A: The business environment is becoming more competitive, and the business needs to compete with each…
Q: 1. Sort the jobs according to the first come first served rule and the shortest processing time rule…
A: Formula Used: Flow Time= Sum of previous Processing time+ Current Processing time Total flow…
Q: 3.Solve the Least Support Tree Problem There are 6 offices, namely, A,B,C,D,E,F and G (see following…
A: Minimum spanning tree: Graph/route containing all the vertices (nodes) with minimum number of edges…
Q: s part of the design of its control system, a company has established financial, marketing,…
A: Explanation : Management by function : Planning: When you consider planning in a management job,…
Q: Inventory and supply chain management concepts (6) When is it appropriate to use an…
A: Economic order quantity - (EOQ) is the immaculate quantity of units a business, must purchase to…
Q: Using the following data, calculate X and S charts Sample X1 2 3 4 5 6 0.078 0.082 0.102 0.079 0.085…
A: Given-
Q: 15. The Goodparts Company produces a component that is subsequently used in the aero- space…
A: Bottleneck resource is the resource which has the least capacityProcess Capacity=Capacity of the…
Q: Which annual inventory cost component does the blue line represent? Total cost Which annual…
A: In the graph, annual costs such as holding, ordering, and total cost are demonstrated on the…
Q: The five risk management approaches should be listed and briefly defined.
A: Risk management refers to handling and controlling the risks associated with a project or company in…
Q: 1. How new entrant disrupt the market?
A: NOTE: ONLY FIRST ONE IS SOLVED SINCE MORE THAN 1 QUESTION IS POSTED When a business establishes a…
Q: SOM 306: Operations Management 5. A work cell is required to make 250 computerized diagnostic…
A: Formulae used: Required assemblies = 250 units Workable productive hours = 6.5 hr = (6.5 x 60 )…
Q: 1.2 Carbondale Casting produces cast bronze valve a 10-person assembly line. On a recent day, 160…
A: Given- No. of workers in the assembly line = 10 workersLabor hours = 8 hrsOutput production = 160…
Q: Question is for Management ) list the causes of poor employee efficiency and engagement in an…
A: Poor employee efficiency and engagement means the situation when the performance and…
Q: roject Managemet 7. Discuss and demonstrate the Project Life Cycle for a typical project…
A: Every project, program, and product have a unique project life cycle with distinct development…
Q: PA 14-5 A Cold Inc is a frozen food distributor with... Use Table 14.1. ACold Inc is a frozen food…
A: Given data: Mean demand (d) =387 Standard deviation (σ) = 152 Lead time (L) = 4 days
Q: Variable Cells Model Variable W M Constraints Constraint Number 1 2 3 Name Westem Foods Salsa Mexico…
A: Given sensitivity report-
Q: Case Study It’s been 6 months since Kolab was hired to lead a large, nonprofit organization…
A: Disclaimer- "As per the guidelines, we will solve only the first three parts of the question for…
Q: [Three decimal places for all answers) (1) What is the expected tosk time of activity B? (2) What is…
A: Given the data shown below, Optimistic Most likely Pessimistic A 14 18 23 B 4 10 18 C 5…
Q: Rylon Corporation manufactures Brute cologne and Chanelle perfume. The raw material needed to…
A: Note: I have answered for sub-parts (1) to (3). Kindly post the remaining sub-parts separately.
Q: Is acting ethical in a business environment the right thing to do from a moral perspective?
A: Being ethical is acting ethically and treating other people well for their own sake, not out of fear…
Q: Describe the system's plans for storing and retrieving files pertaining to schedules.
A: A system in the organization is a set of activities or steps that are interconnected and lead the…
Q: Construct a network using the information in the table and identify the critical path. Compute early…
A: For each activity, I have been given the task time, Immediate predecessors, The table data is shown…
Q: Give some advice that could be useful for adequate change control on projects that include outside…
A: Here, I would present advice for performing adequate change control on projects that include outside…
Q: Question 04: Use Holts Model to solve the following, Assuming a at 0.2 and 3 at 0.3
A: Given the data stated below, Time Scale 1 600 2 1550 3 1500 4 1500 5 2400 6 3100…
Q: A manager uses a trend equation plus quarterly relatives to predict demand. Quarter relatives areSR1…
A: Quarter relatives-SR1 = .90SR2 = .95SR3 = 1.05SR4 = 1.10The trend equation is: Ft = 10 + 5t
Q: FedEx noted that inclement weather and last-minute online sales surges impacted the company’s…
A: Parcel delivery is the individual dispatch of cargo containers, goods, or high-value mail. Most…
Q: 36. Improvement assessment involves responding to the Impact assessment and the prioritization of…
A: The business environment is becoming more competitive, and the business needs to compete with each…
Q: Ronald Lau, chief engineer at South Dakota Electronics, has to decide whether to build a new…
A: Decision analysis is a part of business operations where the organization has to take a decision…
Q: What TOC method could be used to relieve or improve workflow
A: Theory of Constraints is a system-based philosophy which states that the constraint in a system…
Q: Consider the PERT network given below: 10 1-2-3 20 8-10-12 3-4-6 3-5-7 30 40 50 4-5-6 7-8-9 60…
A: 1. During forward pass in case of more than two preceding activities the early start will be…
Q: Assume that a customer in the small contractor target market segment buys an electric drill on…
A: Find the Calculation methods below: Value of a loyal customer (VLC) = P*M*R*BLCP - Selling Price…
Q: The following is a table of activities associated with a project at Rafay Ishfaq's software firm in…
A: In order to arrive at the Total crashing cost, first we need to determine the Critical Path of the…
Q: Startdate: April 8, 2022 (Friday) Working days: Mon-Sat How many days should it take the class to do…
A: Here, for activity E, time estimate data is not given, In the table data, for each activity, I have…
Q: 3. A batch of exported goods of 400 cases, 50 kg, 60 x 40 x 30CM per case, were shipped from Tianjin…
A: Given that, The number of cases exported = 400 casesThe dimensions of the case = 50kg, 60×40×30cm…
Q: There is a firm deciding on the Economic order quantity for two brands P and Q onnthe basis of…
A: Here, there are two brands P and Q, For the brand Q, Annual demand is 2560 The relevant order cost…
Q: 2. The Smith boys want to get the new Xbox console for Christmas buy it because the family already…
A: Economies of Scale means: When the scale or magnitude of the production produced by a firm…
Q: Aventis is a major manufacturer of the flu (influenza) vaccine in the U.S. Aventis manufactures the…
A:
Q: The sanitary landfill charges companies $200 per load and individuals $50 per load. On average, 20…
A: Find the Calculations below: So the answer is Less than 18000 dollars
Q: A server operates with 70% utilization. The coefficient of variation for the service process is 0.6…
A: As per guidelines, in case of multiple questions, first has to be answered. Repost for another…
Q: Quality Air Conditioning manufactures three home air conditioners: an economy model, a standard…
A: Given- Max 67E + 95S + 133Ds.t.1E + 1S + 1D ≤ 300 Fan motors1E + 2S + 4D ≤ 340 Cooling coils8E + 12S…
Q: 1. What is revenue management? A. The use of pricing to increase profits generated from a limited…
A: In the organization, supply chain management or SCM is the managing of the smooth flow of products…
Q: QUESTION 1 A multiple channel queuing system with a Poisson arrival rate, and an exponential service…
A: Given - Arrival rate λ= 2.5 customer/hourService rate μ=80 minuetes/customer
Q: How does technology influence service expectations?
A: The way that organizations and their consumers communicate with one another is changing as a result…
Q: Why is it critical to ensure that there are no data entry errors while using an e-commerce website?
A: Outsourcing data entry has become a crucial part of simplifying sales and marketing databases. It's…
Q: Understanding the MRP system's data processing methodology is crucial.
A: One of the most comprehensive approaches to manufacturing inventory and other related variables that…
Q: a small distribution center, carries 12,000 items. During any particular week, Domain's customers…
A: Find the Calculation methods below: In-Stock Probability = (ESED)*100ES - Expected Stock outED -…


Trending now
This is a popular solution!

Step by step
Solved in 7 steps with 10 images

- Suppose that a regional express delivery service company wants to estimate the cost of shipping a package (Y) as a function of cargo type, where cargo type includes the following possibilities: fragile, semifragile, and durable. Costs for 15 randomly chosen packages of approximately the same weight and same distance shipped, but of different cargo types, are provided in the file P13_16.xlsx. a. Estimate a regression equation using the given sample data, and interpret the estimated regression coefficients. b. According to the estimated regression equation, which cargo type is the most costly to ship? Which cargo type is the least costly to ship? c. How well does the estimated equation fit the given sample data? How might the fit be improved? d. Given the estimated regression equation, predict the cost of shipping a package with semifragile cargo.An automobile manufacturer is considering whether to introduce a new model called the Racer. The profitability of the Racer depends on the following factors: The fixed cost of developing the Racer is triangularly distributed with parameters 3, 4, and 5, all in billions. Year 1 sales are normally distributed with mean 200,000 and standard deviation 50,000. Year 2 sales are normally distributed with mean equal to actual year 1 sales and standard deviation 50,000. Year 3 sales are normally distributed with mean equal to actual year 2 sales and standard deviation 50,000. The selling price in year 1 is 25,000. The year 2 selling price will be 1.05[year 1 price + 50 (% diff1)] where % diff1 is the number of percentage points by which actual year 1 sales differ from expected year 1 sales. The 1.05 factor accounts for inflation. For example, if the year 1 sales figure is 180,000, which is 10 percentage points below the expected year 1 sales, then the year 2 price will be 1.05[25,000 + 50( 10)] = 25,725. Similarly, the year 3 price will be 1.05[year 2 price + 50(% diff2)] where % diff2 is the percentage by which actual year 2 sales differ from expected year 2 sales. The variable cost in year 1 is triangularly distributed with parameters 10,000, 12,000, and 15,000, and it is assumed to increase by 5% each year. Your goal is to estimate the NPV of the new car during its first three years. Assume that the company is able to produce exactly as many cars as it can sell. Also, assume that cash flows are discounted at 10%. Simulate 1000 trials to estimate the mean and standard deviation of the NPV for the first three years of sales. Also, determine an interval such that you are 95% certain that the NPV of the Racer during its first three years of operation will be within this interval.The eTech Company is a fairly recent entry in the electronic device area. The company competes with Apple. Samsung, and other well-known companies in the manufacturing and sales of personal handheld devices. Although eTech recognizes that it is a niche player and will likely remain so in the foreseeable future, it is trying to increase its current small market share in this huge competitive market. Jim Simons, VP of Production, and Catherine Dolans, VP of Marketing, have been discussing the possible addition of a new product to the companys current (rather limited) product line. The tentative name for this new product is ePlayerX. Jim and Catherine agree that the ePlayerX, which will feature a sleeker design and more memory, is necessary to compete successfully with the big boys, but they are also worried that the ePlayerX could cannibalize sales of their existing productsand that it could even detract from their bottom line. They must eventually decide how much to spend to develop and manufacture the ePlayerX and how aggressively to market it. Depending on these decisions, they must forecast demand for the ePlayerX, as well as sales for their existing products. They also realize that Apple. Samsung, and the other big players are not standing still. These competitors could introduce their own new products, which could have very negative effects on demand for the ePlayerX. The expected timeline for the ePlayerX is that development will take no more than a year to complete and that the product will be introduced in the market a year from now. Jim and Catherine are aware that there are lots of decisions to make and lots of uncertainties involved, but they need to start somewhere. To this end. Jim and Catherine have decided to base their decisions on a planning horizon of four years, including the development year. They realize that the personal handheld device market is very fluid, with updates to existing products occurring almost continuously. However, they believe they can include such considerations into their cost, revenue, and demand estimates, and that a four-year planning horizon makes sense. In addition, they have identified the following problem parameters. (In this first pass, all distinctions are binary: low-end or high-end, small-effect or large-effect, and so on.) In the absence of cannibalization, the sales of existing eTech products are expected to produce year I net revenues of 10 million, and the forecast of the annual increase in net revenues is 2%. The ePIayerX will be developed as either a low-end or a high-end product, with corresponding fixed development costs (1.5 million or 2.5 million), variable manufacturing costs ( 100 or 200). and selling prices (150 or 300). The fixed development cost is incurred now, at the beginning of year I, and the variable cost and selling price are assumed to remain constant throughout the planning horizon. The new product will be marketed either mildly aggressively or very aggressively, with corresponding costs. The costs of a mildly aggressive marketing campaign are 1.5 million in year 1 and 0.5 million annually in years 2 to 4. For a very aggressive campaign, these costs increase to 3.5 million and 1.5 million, respectively. (These marketing costs are not part of the variable cost mentioned in the previous bullet; they are separate.) Depending on whether the ePlayerX is a low-end or high-end produce the level of the ePlayerXs cannibalization rate of existing eTech products will be either low (10%) or high (20%). Each cannibalization rate affects only sales of existing products in years 2 to 4, not year I sales. For example, if the cannibalization rate is 10%, then sales of existing products in each of years 2 to 4 will be 10% below their projected values without cannibalization. A base case forecast of demand for the ePlayerX is that in its first year on the market, year 2, demand will be for 100,000 units, and then demand will increase by 5% annually in years 3 and 4. This base forecast is based on a low-end version of the ePlayerX and mildly aggressive marketing. It will be adjusted for a high-end will product, aggressive marketing, and competitor behavior. The adjustments with no competing product appear in Table 2.3. The adjustments with a competing product appear in Table 2.4. Each adjustment is to demand for the ePlayerX in each of years 2 to 4. For example, if the adjustment is 10%, then demand in each of years 2 to 4 will be 10% lower than it would have been in the base case. Demand and units sold are the samethat is, eTech will produce exactly what its customers demand so that no inventory or backorders will occur. Table 2.3 Demand Adjustments When No Competing Product Is Introduced Table 2.4 Demand Adjustments When a Competing Product Is Introduced Because Jim and Catherine are approaching the day when they will be sharing their plans with other company executives, they have asked you to prepare an Excel spreadsheet model that will answer the many what-if questions they expect to be asked. Specifically, they have asked you to do the following: You should enter all of the given data in an inputs section with clear labeling and appropriate number formatting. If you believe that any explanations are required, you can enter them in text boxes or cell comments. In this section and in the rest of the model, all monetary values (other than the variable cost and the selling price) should be expressed in millions of dollars, and all demands for the ePlayerX should be expressed in thousands of units. You should have a scenario section that contains a 0/1 variable for each of the binary options discussed here. For example, one of these should be 0 if the low-end product is chosen and it should be 1 if the high-end product is chosen. You should have a parameters section that contains the values of the various parameters listed in the case, depending on the values of the 0/1 variables in the previous bullet For example, the fixed development cost will be 1.5 million or 2.5 million depending on whether the 0/1 variable in the previous bullet is 0 or 1, and this can be calculated with a simple IF formula. You can decide how to implement the IF logic for the various parameters. You should have a cash flows section that calculates the annual cash flows for the four-year period. These cash flows include the net revenues from existing products, the marketing costs for ePlayerX, and the net revenues for sales of ePlayerX (To calculate these latter values, it will help to have a row for annual units sold of ePlayerX.) The cash flows should also include depreciation on the fixed development cost, calculated on a straight-line four-year basis (that is. 25% of the cost in each of the four years). Then, these annual revenues/costs should be summed for each year to get net cash flow before taxes, taxes should be calculated using a 32% tax rate, and taxes should be subtracted and depreciation should be added back in to get net cash flows after taxes. (The point is that depreciation is first subtracted, because it is not taxed, but then it is added back in after taxes have been calculated.) You should calculate the company's NPV for the four-year horizon using a discount rate of 10%. You can assume that the fixed development cost is incurred now. so that it is not discounted, and that all other costs and revenues are incurred at the ends of the respective years. You should accompany all of this with a line chart with three series: annual net revenues from existing products; annual marketing costs for ePlayerX; and annual net revenues from sales of ePlayerX. Once all of this is completed. Jim and Catherine will have a powerful tool for presentation purposes. By adjusting the 0/1 scenario variables, their audience will be able to see immediately, both numerically and graphically, the financial consequences of various scenarios.
- The management of a technology company is trying to determine the variable that best explains the variation of employee salaries using a sample of 52 full-time employees; see the file P13_08.xlsx. Estimate simple linear regression equations to identify which of the following has the strongest linear relationship with annual salary: the employees gender, age, number of years of relevant work experience prior to employment at the company, number of years of employment at the company, or number of years of post secondary education. Provide support for your conclusion.Seas Beginning sells clothing by mail order. An important question is when to strike a customer from the companys mailing list. At present, the company strikes a customer from its mailing list if a customer fails to order from six consecutive catalogs. The company wants to know whether striking a customer from its list after a customer fails to order from four consecutive catalogs results in a higher profit per customer. The following data are available: If a customer placed an order the last time she received a catalog, then there is a 20% chance she will order from the next catalog. If a customer last placed an order one catalog ago, there is a 16% chance she will order from the next catalog she receives. If a customer last placed an order two catalogs ago, there is a 12% chance she will order from the next catalog she receives. If a customer last placed an order three catalogs ago, there is an 8% chance she will order from the next catalog she receives. If a customer last placed an order four catalogs ago, there is a 4% chance she will order from the next catalog she receives. If a customer last placed an order five catalogs ago, there is a 2% chance she will order from the next catalog she receives. It costs 2 to send a catalog, and the average profit per order is 30. Assume a customer has just placed an order. To maximize expected profit per customer, would Seas Beginning make more money canceling such a customer after six nonorders or four nonorders?Stock market analysts are continually looking for reliable predictors of stock prices. Consider the problem of modeling the price per share of electric utility stocks (Y). Two variables thought to influence this stock price are return on average equity (X1) and annual dividend rate (X2). The stock price, returns on equity, and dividend rates on a randomly selected day for 16 electric utility stocks are provided in the file P13_15.xlsx. Estimate a multiple regression equation using the given data. Interpret each of the estimated regression coefficients. Also, interpret the standard error of estimate and the R-square value for these data.
- Based on Babich (1992). Suppose that each week each of 300 families buys a gallon of orange juice from company A, B, or C. Let pA denote the probability that a gallon produced by company A is of unsatisfactory quality, and define pB and pC similarly for companies B and C. If the last gallon of juice purchased by a family is satisfactory, the next week they will purchase a gallon of juice from the same company. If the last gallon of juice purchased by a family is not satisfactory, the family will purchase a gallon from a competitor. Consider a week in which A families have purchased juice A, B families have purchased juice B, and C families have purchased juice C. Assume that families that switch brands during a period are allocated to the remaining brands in a manner that is proportional to the current market shares of the other brands. For example, if a customer switches from brand A, there is probability B/(B + C) that he will switch to brand B and probability C/(B + C) that he will switch to brand C. Suppose that the market is currently divided equally: 10,000 families for each of the three brands. a. After a year, what will the market share for each firm be? Assume pA = 0.10, pB = 0.15, and pC = 0.20. (Hint: You will need to use the RISKBINOMLAL function to see how many people switch from A and then use the RISKBENOMIAL function again to see how many switch from A to B and from A to C. However, if your model requires more RISKBINOMIAL functions than the number allowed in the academic version of @RISK, remember that you can instead use the BENOM.INV (or the old CRITBENOM) function to generate binomially distributed random numbers. This takes the form =BINOM.INV (ntrials, psuccess, RAND()).) b. Suppose a 1% increase in market share is worth 10,000 per week to company A. Company A believes that for a cost of 1 million per year it can cut the percentage of unsatisfactory juice cartons in half. Is this worthwhile? (Use the same values of pA, pB, and pC as in part a.)A company manufacturers a product in the United States and sells it in England. The unit cost of manufacturing is 50. The current exchange rate (dollars per pound) is 1.221. The demand function, which indicates how many units the company can sell in England as a function of price (in pounds) is of the power type, with constant 27556759 and exponent 2.4. a. Develop a model for the companys profit (in dollars) as a function of the price it charges (in pounds). Then use a data table to find the profit-maximizing price to the nearest pound. b. If the exchange rate varies from its current value, does the profit-maximizing price increase or decrease? Does the maximum profit increase or decrease?Assume a very good NBA team has a 70% chance of winning in each game it plays. During an 82-game season what is the average length of the teams longest winning streak? What is the probability that the team has a winning streak of at least 16 games? Use simulation to answer these questions, where each iteration of the simulation generates the outcomes of all 82 games.
- Although the normal distribution is a reasonable input distribution in many situations, it does have two potential drawbacks: (1) it allows negative values, even though they may be extremely improbable, and (2) it is a symmetric distribution. Many situations are modelled better with a distribution that allows only positive values and is skewed to the right. Two of these that have been used in many real applications are the gamma and lognormal distributions. @RISK enables you to generate observations from each of these distributions. The @RISK function for the gamma distribution is RISKGAMMA, and it takes two arguments, as in =RISKGAMMA(3,10). The first argument, which must be positive, determines the shape. The smaller it is, the more skewed the distribution is to the right; the larger it is, the more symmetric the distribution is. The second argument determines the scale, in the sense that the product of it and the first argument equals the mean of the distribution. (The mean in this example is 30.) Also, the product of the second argument and the square root of the first argument is the standard deviation of the distribution. (In this example, it is 3(10=17.32.) The @RISK function for the lognormal distribution is RISKLOGNORM. It has two arguments, as in =RISKLOGNORM(40,10). These arguments are the mean and standard deviation of the distribution. Rework Example 10.2 for the following demand distributions. Do the simulated outputs have any different qualitative properties with these skewed distributions than with the triangular distribution used in the example? a. Gamma distribution with parameters 2 and 85 b. Gamma distribution with parameters 5 and 35 c. Lognormal distribution with mean 170 and standard deviation 60Play Things is developing a new Lady Gaga doll. The company has made the following assumptions: The doll will sell for a random number of years from 1 to 10. Each of these 10 possibilities is equally likely. At the beginning of year 1, the potential market for the doll is two million. The potential market grows by an average of 4% per year. The company is 95% sure that the growth in the potential market during any year will be between 2.5% and 5.5%. It uses a normal distribution to model this. The company believes its share of the potential market during year 1 will be at worst 30%, most likely 50%, and at best 60%. It uses a triangular distribution to model this. The variable cost of producing a doll during year 1 has a triangular distribution with parameters 15, 17, and 20. The current selling price is 45. Each year, the variable cost of producing the doll will increase by an amount that is triangularly distributed with parameters 2.5%, 3%, and 3.5%. You can assume that once this change is generated, it will be the same for each year. You can also assume that the company will change its selling price by the same percentage each year. The fixed cost of developing the doll (which is incurred right away, at time 0) has a triangular distribution with parameters 5 million, 7.5 million, and 12 million. Right now there is one competitor in the market. During each year that begins with four or fewer competitors, there is a 25% chance that a new competitor will enter the market. Year t sales (for t 1) are determined as follows. Suppose that at the end of year t 1, n competitors are present (including Play Things). Then during year t, a fraction 0.9 0.1n of the company's loyal customers (last year's purchasers) will buy a doll from Play Things this year, and a fraction 0.2 0.04n of customers currently in the market ho did not purchase a doll last year will purchase a doll from Play Things this year. Adding these two provides the mean sales for this year. Then the actual sales this year is normally distributed with this mean and standard deviation equal to 7.5% of the mean. a. Use @RISK to estimate the expected NPV of this project. b. Use the percentiles in @ RISKs output to find an interval such that you are 95% certain that the companys actual NPV will be within this interval.The annual demand for Prizdol, a prescription drug manufactured and marketed by the NuFeel Company, is normally distributed with mean 50,000 and standard deviation 12,000. Assume that demand during each of the next 10 years is an independent random number from this distribution. NuFeel needs to determine how large a Prizdol plant to build to maximize its expected profit over the next 10 years. If the company builds a plant that can produce x units of Prizdol per year, it will cost 16 for each of these x units. NuFeel will produce only the amount demanded each year, and each unit of Prizdol produced will sell for 3.70. Each unit of Prizdol produced incurs a variable production cost of 0.20. It costs 0.40 per year to operate a unit of capacity. a. Among the capacity levels of 30,000, 35,000, 40,000, 45,000, 50,000, 55,000, and 60,000 units per year, which level maximizes expected profit? Use simulation to answer this question. b. Using the capacity from your answer to part a, NuFeel can be 95% certain that actual profit for the 10-year period will be between what two values?